
Page 183 - Applied Statistics Using SPSS, STATISTICA, MATLAB and R
P. 183
4.5 Inference on More than Two Populations 163
c. The comparison between hospital 3 versus the others uses the assignment rule
for merged groups already explained in 4.5.2.2.
d. The comparison between all hospitals, for category 1 of APCLASS, uses two
independent contrasts. These are tested simultaneously, representing an
exhaustive set of contrasts that compare all levels of HOSP. Category 0 of
APCLASS is removed from the analysis by assigning a zero coefficient to it.
Table 4.23. Contrast coefficients and significance for the comparisons described in
Example 4.21.
Contrast (a) (b) (c) (d)
APCLASS 0 HOSP 2 HOSP 3 HOSP
Description vs. vs. vs. for
APCLASS 1 HOSP 3 {HOSP 1, HOSP 2} APCLASS 1
1 0 −1
HOSP coef. 1 1 1 0 1 −1 1 1 −2
0 1 −1
APCLASS coef. 1 −1 1 1 1 1 0 1
p 0.00 0.00 0.29 0.00
80
70
60
Estimated Marginal Means 50 APCLASS
40
0
30
2
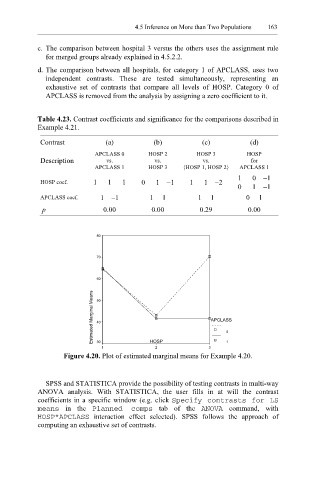
1 HOSP 3 1
Figure 4.20. Plot of estimated marginal means for Example 4.20.
SPSS and STATISTICA provide the possibility of testing contrasts in multi-way
ANOVA analysis. With STATISTICA, the user fills in at will the contrast
coefficients in a specific window (e.g. click Specify contrasts for LS
means in the Planned comps tab of the A NOVA command, with
HOSP*APCLASS interaction effect selected). SPSS follows the approach of
computing an exhaustive set of contrasts.