
Page 184 - Applied Statistics Using SPSS, STATISTICA, MATLAB and R
P. 184
164 4 Parametric Tests of Hypotheses
The observed significance values in the last row of Table 4.23 lead to the
rejection of the null hypothesis for all contrasts except contrast (c).
Example 4.22
Q: Determine the power for the two-way ANOVA test of previous Example 4.20
and the minimum number of cases per group that affords a row effect power above
95%.
A: Power computations for the two-way ANOVA follow the approach explained in
section 4.5.2.3.
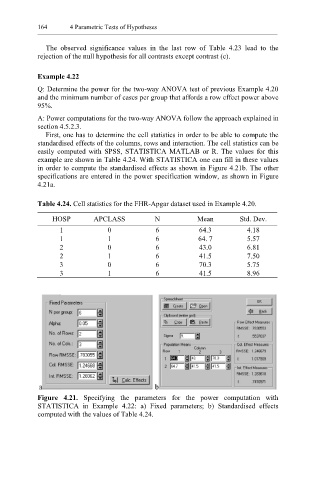
First, one has to determine the cell statistics in order to be able to compute the
standardised effects of the columns, rows and interaction. The cell statistics can be
easily computed with SPSS, STATISTICA MATLAB or R. The values for this
example are shown in Table 4.24. With STATISTICA one can fill in these values
in order to compute the standardised effects as shown in Figure 4.21b. The other
specifications are entered in the power specification window, as shown in Figure
4.21a.
Table 4.24. Cell statistics for the FHR-Apgar dataset used in Example 4.20.
HOSP APCLASS N Mean Std. Dev.
1 0 6 64.3 4.18
1 1 6 64. 7 5.57
2 0 6 43.0 6.81
2 1 6 41.5 7.50
3 0 6 70.3 5.75
3 1 6 41.5 8.96
Figure 4.21. Specifying the parameters for the power computation with
STATISTICA in Example 4.22: a) Fixed parameters; b) Standardised effects
computed with the values of Table 4.24.