
Page 182 - Applied Statistics Using SPSS, STATISTICA, MATLAB and R
P. 182
162 4 Parametric Tests of Hypotheses
A: Using specific tests described in the following chapter, it is possible to show
that variable ASTV can be assumed to approximately follow a normal distribution
for most combinations of the factor levels. We use the subset of cases marked with
yellow colour in the FHR-Apgar.xls file. For these cases Levene’s test yields an
observed significance of p = 0.48; therefore, the equality of variance assumption is
not rejected. We are then entitled to apply the two-way ANOVA test to the dataset.
The two-way ANOVA test results, obtained with SPSS, are shown in Table 4.22
(factors HOSP ≡ Hospital; APCLASS ≡ Apgar 1 class). We see that the null
hypothesis is rejected for the effects and their interaction (HOSP * APCLASS).
Thus, the test provides evidence that the heart rate variability index ASTV has
different means according to the Hospital and to the Apgar 1 category.
Figure 4.20 illustrates the interaction effect on the means. Category 3 of HOSP
has quite different means depending on the APCLASS category.
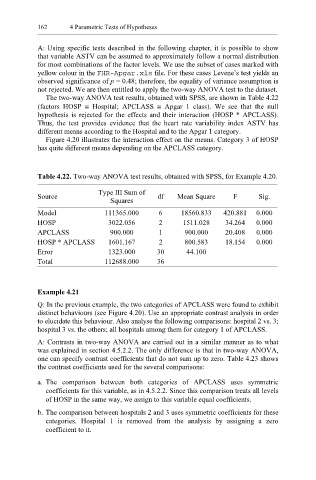
Table 4.22. Two-way ANOVA test results, obtained with SPSS, for Example 4.20.
Type III Sum of
Source df Mean Square F Sig.
Squares
Model 111365.000 6 18560.833 420.881 0.000
HOSP 3022.056 2 1511.028 34.264 0.000
APCLASS 900.000 1 900.000 20.408 0.000
HOSP * APCLASS 1601.167 2 800.583 18.154 0.000
Error 1323.000 30 44.100
Total 112688.000 36
Example 4.21
Q: In the previous example, the two categories of APCLASS were found to exhibit
distinct behaviours (see Figure 4.20). Use an appropriate contrast analysis in order
to elucidate this behaviour. Also analyse the following comparisons: hospital 2 vs. 3;
hospital 3 vs. the others; all hospitals among them for category 1 of APCLASS.
A: Contrasts in two-way ANOVA are carried out in a similar manner as to what
was explained in section 4.5.2.2. The only difference is that in two-way ANOVA,
one can specify contrast coefficients that do not sum up to zero. Table 4.23 shows
the contrast coefficients used for the several comparisons:
a. The comparison between both categories of APCLASS uses symmetric
coefficients for this variable, as in 4.5.2.2. Since this comparison treats all levels
of HOSP in the same way, we assign to this variable equal coefficients.
b. The comparison between hospitals 2 and 3 uses symmetric coefficients for these
categories. Hospital 1 is removed from the analysis by assigning a zero
coefficient to it.