
Page 185 - Applied Statistics Using SPSS, STATISTICA, MATLAB and R
P. 185
4.5 Inference on More than Two Populations 165
2-Way (2 X 3) ANOVA
Row Effect Power vs. N (RMSSE = 0.783055, Alpha = 0.05)
1.00
.95
Power .90
.85
Group Sample Size (N)
.80
0 5 10 15 20 25 30
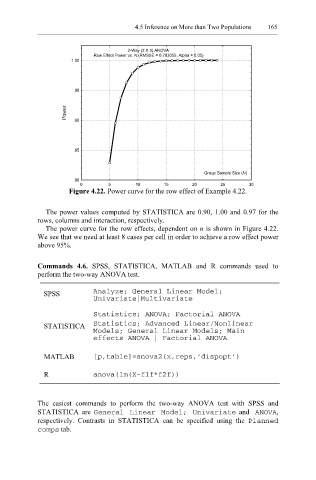
Figure 4.22. Power curve for the row effect of Example 4.22.
The power values computed by STATISTICA are 0.90, 1.00 and 0.97 for the
rows, columns and interaction, respectively.
The power curve for the row effects, dependent on n is shown in Figure 4.22.
We see that we need at least 8 cases per cell in order to achieve a row effect power
above 95%.
Commands 4.6. SPSS, STATISTICA, MATLAB and R commands used to
perform the two-way ANOVA test.
SPSS Analyze; General Linear Model;
Univariate|Multivariate
Statistics; ANOVA; Factorial ANOVA
STATISTICA Statistics; Advanced Linear/Nonlinear
Models; General Linear Models; Main
effects ANOVA | Factorial ANOVA
MATLAB [p,table]=anova2(x,reps,’dispopt’)
R anova(lm(X~f1f*f2f))
The easiest commands to perform the two-way ANOVA test with SPSS and
STATISTICA are General Linear Model; Univariate and ANOVA ,
respectively. Contrasts in STATISTICA can be specified using the Planned
comps tab.