
Page 176 - Applied Statistics Using SPSS, STATISTICA, MATLAB and R
P. 176
156 4 Parametric Tests of Hypotheses
determine the minimum value of n that will guarantee a power of at least 95% in
the conditions of the test.
A: We compute the power for the worst case of n: n = 14. Using the sample means
as the means corresponding to the alternative hypothesis, and the estimate of the
standard deviation s = 0.068, we obtain a standardised effect RMSSE = 0.6973. In
these conditions, the power is 99.7%.
Figure 4.17 shows the respective power curve. We see that a value of n ≥ 10
guarantees a power higher than 95%.
4.5.3 Two-Way ANOVA
In the two-way ANOVA test we consider that the variable being tested, X, is
categorised by two independent factors, say Factor 1 and Factor 2. We say that X
depends on two factors: Factor 1 and Factor 2.
Assuming that Factor 1 has c categories and Factor 2 has r categories, and that
there is only one random observation for every combination of categories of the
factors, we get the situation shown in Table 4.19. The means for the Factor 1
categories are denoted x , x , ..., x . The means for the Factor 2 categories are
. 1
. 2
. c
denoted x , x , ..., x . The total mean for all observations is denoted x .
r .
..
1 .
2 .
Note that the situation shown in Table 4.19 constitutes a generalisation to
multiple samples of the comparison of means for two paired samples described in
section 4.4.3.3. One can, for instance, view the cases as being paired according to
Factor 2 and compare the means for Factor 1. The inverse situation is, of course,
also possible.
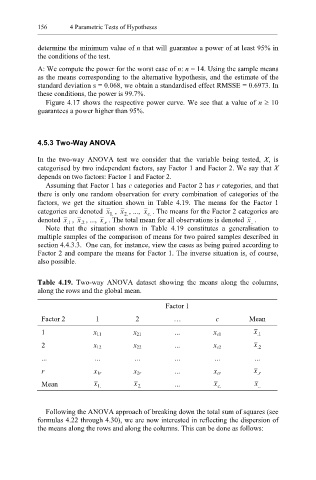
Table 4.19. Two-way ANOVA dataset showing the means along the columns,
along the rows and the global mean.
Factor 1
Factor 2 1 2 … c Mean
1 x 11 x 21 ... x c1 x
1 .
2 x 12 x 22 ... x c2 x
2 .
... ... ... ... ... ...
r x 1r x 2r ... x cr x
r .
Mean x x ... x x
. c
..
. 1
. 2
Following the ANOVA approach of breaking down the total sum of squares (see
formulas 4.22 through 4.30), we are now interested in reflecting the dispersion of
the means along the rows and along the columns. This can be done as follows: