
Page 168 - Applied Statistics Using SPSS, STATISTICA, MATLAB and R
P. 168
148 4 Parametric Tests of Hypotheses
900
800
700
600
Values 500
400
300
200
100
0
1 2 3
Column Number
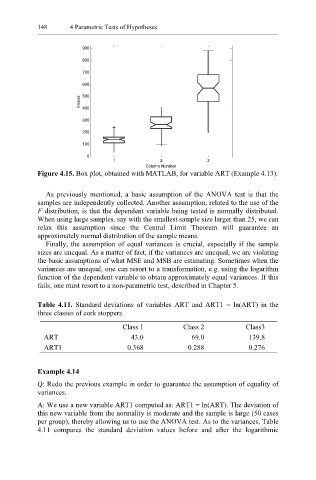
Figure 4.15. Box plot, obtained with MATLAB, for variable ART (Example 4.13).
As previously mentioned, a basic assumption of the ANOVA test is that the
samples are independently collected. Another assumption, related to the use of the
F distribution, is that the dependent variable being tested is normally distributed.
When using large samples, say with the smallest sample size larger than 25, we can
relax this assumption since the Central Limit Theorem will guarantee an
approximately normal distribution of the sample means.
Finally, the assumption of equal variances is crucial, especially if the sample
sizes are unequal. As a matter of fact, if the variances are unequal, we are violating
the basic assumptions of what MSE and MSB are estimating. Sometimes when the
variances are unequal, one can resort to a transformation, e.g. using the logarithm
function of the dependent variable to obtain approximately equal variances. If this
fails, one must resort to a non-parametric test, described in Chapter 5.
Table 4.11. Standard deviations of variables ART and ART1 = ln(ART) in the
three classes of cork stoppers.
Class 1 Class 2 Class3
ART 43.0 69.0 139.8
ART1 0.368 0.288 0.276
Example 4.14
Q: Redo the previous example in order to guarantee the assumption of equality of
variances.
A: We use a new variable ART1 computed as: ART1 = ln(ART). The deviation of
this new variable from the normality is moderate and the sample is large (50 cases
per group), thereby allowing us to use the ANOVA test. As to the variances, Table
4.11 compares the standard deviation values before and after the logarithmic