
Page 169 - Applied Statistics Using SPSS, STATISTICA, MATLAB and R
P. 169
4.5 Inference on More than Two Populations 149
transformation. Notice how the transformation yielded approximate standard
deviations, capitalising on the fact that the logarithm de-emphasises large values.
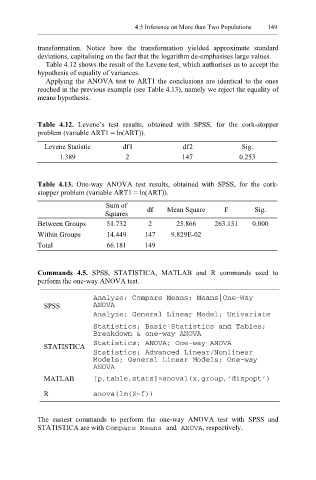
Table 4.12 shows the result of the Levene test, which authorises us to accept the
hypothesis of equality of variances.
Applying the ANOVA test to ART1 the conclusions are identical to the ones
reached in the previous example (see Table 4.13), namely we reject the equality of
means hypothesis.
Table 4.12. Levene’s test results, obtained with SPSS, for the cork-stopper
problem (variable ART1 = ln(ART)).
Levene Statistic df1 df2 Sig.
1.389 2 147 0.253
Table 4.13. One-way ANOVA test results, obtained with SPSS, for the cork-
stopper problem (variable ART1 = ln(ART)).
Sum of
Squares df Mean Square F Sig.
Between Groups 51.732 2 25.866 263.151 0.000
Within Groups 14.449 147 9.829E-02
Total 66.181 149
Commands 4.5. SPSS, STATISTICA, MATLAB and R commands used to
perform the one-way ANOVA test.
Analyze; Compare Means; Means|One-Way
SPSS ANOVA
Analyze; General Linear Model; Univariate
Statistics; Basic Statistics and Tables;
Breakdown & one-way ANOVA
STATISTICA Statistics; ANOVA; One-way ANOVA
Statistics; Advanced Linear/Nonlinear
Models; General Linear Models; One-way
ANOVA
MATLAB [p,table,stats]=anova1(x,group,’dispopt’)
R anova(lm(X~f))
The easiest commands to perform the one-way ANOVA test with SPSS and
STATISTICA are with Compare Means and ANOVA , respectively.