
Page 106 - Artificial Intelligence for Computational Modeling of the Heart
P. 106
76 Chapter 2 Implementation of a patient-specific cardiac model
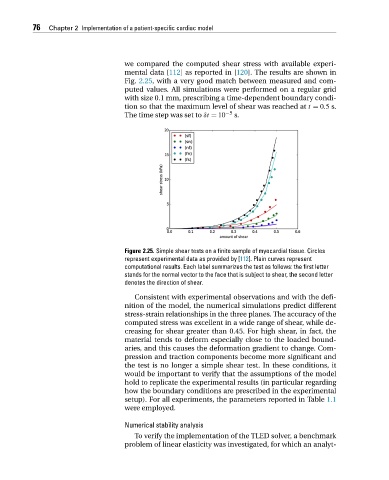
we compared the computed shear stress with available experi-
mental data [112]asreportedin[120]. The results are shown in
Fig. 2.25, with a very good match between measured and com-
puted values. All simulations were performed on a regular grid
with size 0.1 mm, prescribing a time-dependent boundary condi-
tion so that the maximum level of shear was reached at t = 0.5 s.
Thetimestepwas setto δt = 10 −5 s.
Figure 2.25. Simple shear tests on a finite sample of myocardial tissue. Circles
represent experimental data as provided by [112]. Plain curves represent
computational results. Each label summarizes the test as follows: the first letter
stands for the normal vector to the face that is subject to shear, the second letter
denotes the direction of shear.
Consistent with experimental observations and with the defi-
nition of the model, the numerical simulations predict different
stress-strain relationships in the three planes. The accuracy of the
computed stress was excellent in a wide range of shear, while de-
creasing for shear greater than 0.45. For high shear, in fact, the
material tends to deform especially close to the loaded bound-
aries, and this causes the deformation gradient to change. Com-
pression and traction components become more significant and
the test is no longer a simple shear test. In these conditions, it
would be important to verify that the assumptions of the model
hold to replicate the experimental results (in particular regarding
how the boundary conditions are prescribed in the experimental
setup). For all experiments, the parameters reported in Table 1.1
were employed.
Numerical stability analysis
To verify the implementation of the TLED solver, a benchmark
problem of linear elasticity was investigated, for which an analyt-