
Page 173 - Artificial Intelligence for Computational Modeling of the Heart
P. 173
Chapter 4 Data-driven reduction of cardiac models 145
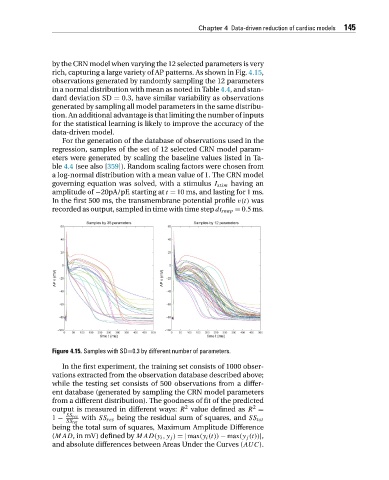
by the CRN model when varying the 12 selected parameters is very
rich, capturing a large variety of AP patterns. As shown in Fig. 4.15,
observations generated by randomly sampling the 12 parameters
in a normal distribution with mean as noted in Table 4.4,and stan-
dard deviation SD = 0.3, have similar variability as observations
generated by sampling all model parameters in the same distribu-
tion. An additional advantage is that limiting the number of inputs
for the statistical learning is likely to improve the accuracy of the
data-driven model.
For the generation of the database of observations used in the
regression, samples of the set of 12 selected CRN model param-
eters were generated by scaling the baseline values listed in Ta-
ble 4.4 (see also [359]). Random scaling factors were chosen from
a log-normal distribution with a mean value of 1. The CRN model
governing equation was solved, with a stimulus I stim having an
amplitude of −20pA/pF, starting at t = 10 ms, and lasting for 1 ms.
In the first 500 ms, the transmembrane potential profile v(t) was
recorded as output, sampled in time with time step dt snap = 0.5 ms.
Figure 4.15. Samples with SD=0.3 by different number of parameters.
In the first experiment, the training set consists of 1000 obser-
vations extracted from the observation database described above;
while the testing set consists of 500 observations from a differ-
ent database (generated by sampling the CRN model parameters
from a different distribution). The goodness of fit of the predicted
2 2
output is measured in different ways: R value defined as R =
SS res
1 − with SS res being the residual sum of squares, and SS tot
SS tot
being the total sum of squares, Maximum Amplitude Difference
(MAD, in mV) defined by MAD(y i ,y j ) =|max(y i (t)) − max(y j (t))|,
and absolute differences between Areas Under the Curves (AUC).