
Page 177 - Artificial Intelligence for Computational Modeling of the Heart
P. 177
Chapter 4 Data-driven reduction of cardiac models 149
Figure 4.19. Regression on APD: MARS (1st row), PPR (2nd row).
ization capability, and a strategy to control the performance could
be based on the definition of multiple specialized models, each
one covering a different distribution of the input parameters, for
instance tailored to represent pathological cases and their typi-
cal input parameter distribution (e.g. the case of atrial fibrillation,
in which APD is typically shorter). The corresponding training
database of observations could be generated by sampling input
parameters in a modified range as in [368]. In the following, we
will only consider distributions of input parameters in the range
of the published reference values for healthy persons [359].
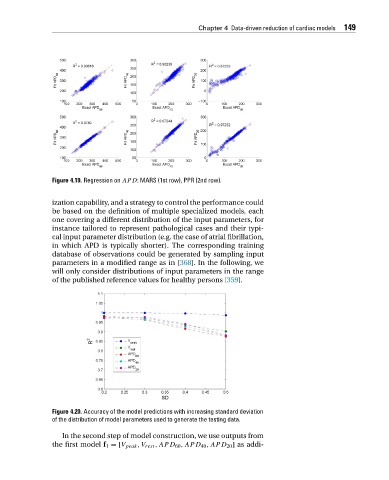
Figure 4.20. Accuracy of the model predictions with increasing standard deviation
of the distribution of model parameters used to generate the testing data.
In the second step of model construction, we use outputs from
the first model f 1 =[V peak ,V rest ,APD 60 ,APD 40 ,APD 20 ] as addi-