
Page 176 - Artificial Intelligence for Computational Modeling of the Heart
P. 176
148 Chapter 4 Data-driven reduction of cardiac models
methods are tested: partial least squares regression (PLSR), MARS,
and PPR. The number of components option is set equal to the
number of model inputs p in PLSR. For MARS, the maximum in-
teraction degree is set to 2, and the maximum number of model
terms to 80. For PPR, the number of terms in the model is set to
10, and the optimization level is set to re-balance the contribu-
2
tions from each regressor at each step. The computed R values
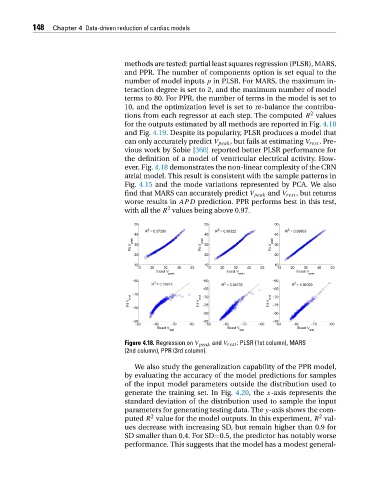
for the outputs estimated by all methods are reported in Fig. 4.18
and Fig. 4.19. Despite its popularity, PLSR produces a model that
can only accurately predict V peak , but fails at estimating V rest .Pre-
vious work by Sobie [360] reported better PLSR performance for
the definition of a model of ventricular electrical activity. How-
ever, Fig. 4.18 demonstrates the non-linear complexity of the CRN
atrial model. This result is consistent with the sample patterns in
Fig. 4.15 and the mode variations represented by PCA. We also
find that MARS can accurately predict V peak and V rest , but returns
worse results in APD prediction. PPR performs best in this test,
2
with all the R values being above 0.97.
Figure 4.18. Regression on V peak and V rest : PLSR (1st column), MARS
(2nd column), PPR (3rd column).
We also study the generalization capability of the PPR model,
by evaluating the accuracy of the model predictions for samples
of the input model parameters outside the distribution used to
generate the training set. In Fig. 4.20,the x-axis represents the
standard deviation of the distribution used to sample the input
parameters for generating testing data. The y-axis shows the com-
2
2
puted R value for the model outputs. In this experiment, R val-
ues decrease with increasing SD, but remain higher than 0.9 for
SD smaller than 0.4. For SD=0.5, the predictor has notably worse
performance. This suggests that the model has a modest general-