
Page 179 - Artificial Intelligence for Computational Modeling of the Heart
P. 179
Chapter 4 Data-driven reduction of cardiac models 151
Table 4.5 PPR prediction error.
M 1 M 2 M 3 M 4
Mean±SD 23.32±16.43 23.25±16.50 0.903±1.214 0.985±1.465
MAD(%)
90-percentile 45.10 45.72 1.749 2.098
Mean±SD 0.86±0.91 0.74±0.85 0.37±0.50 0.67±0.80
V rest (%)
90-percentile 1.83 1.64 0.81 1.42
Mean±SD 3.35±3.59 2.66±3.12 2.88±3.41 2.73±3.31
APD 60 (%)
90-percentile 7.51 6.12 6.59 6.12
Mean±SD 3.56±4.14 2.84± 3.05 2.89±3.52 2.76±2.841
APD 40 (%)
90-percentile 8.30 5.98 6.35 5.61
Mean±SD 5.29±7.02 4.05±4.94 3.72±6.94 3.51±7.47
APD 20 (%)
90-percentile 12.37 8.62 8.06 7.87
Mean±SD 1.70±2.06 1.39±1.55 1.74±2.06 1.26±1.58
AUC(%)
90-percentile 3.65 2.99 3.82 2.70
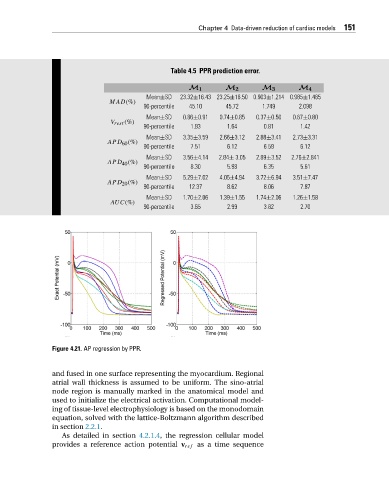
Figure 4.21. AP regression by PPR.
and fused in one surface representing the myocardium. Regional
atrial wall thickness is assumed to be uniform. The sino-atrial
node region is manually marked in the anatomical model and
used to initialize the electrical activation. Computational model-
ing of tissue-level electrophysiology is based on the monodomain
equation, solved with the lattice-Boltzmann algorithm described
in section 2.2.1.
As detailed in section 4.2.1.4, the regression cellular model
provides a reference action potential v ref as a time sequence