
Page 174 - Artificial Intelligence for Computational Modeling of the Heart
P. 174
146 Chapter 4 Data-driven reduction of cardiac models
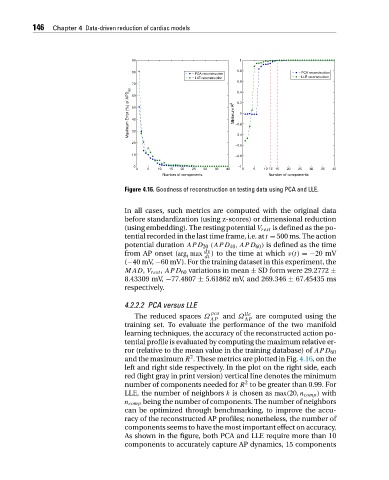
Figure 4.16. Goodness of reconstruction on testing data using PCA and LLE.
In all cases, such metrics are computed with the original data
before standardization (using z-scores) or dimensional reduction
(using embedding). The resting potential V rest is defined as the po-
tential recorded in the last time frame, i.e. at t = 500 ms. The action
potential duration APD 20 (APD 40 ,APD 60 ) is defined as the time
from AP onset (arg max dv ) to the time at which v(t) =−20 mV
t
dt
(−40 mV, −60 mV). For the training dataset in this experiment, the
MAD, V rest , APD 60 variations in mean ± SD form were 29.2772 ±
8.43309 mV, −77.4807 ± 5.61862 mV, and 269.346 ± 67.45435 ms
respectively.
4.2.2.2 PCA versus LLE
pca lle
The reduced spaces Ω and Ω are computed using the
AP AP
training set. To evaluate the performance of the two manifold
learning techniques, the accuracy of the reconstructed action po-
tential profile is evaluated by computing the maximum relative er-
ror (relative to the mean value in the training database) of APD 60
2
and the maximum R . These metrics are plotted in Fig. 4.16,onthe
left and right side respectively. In the plot on the right side, each
red (light gray in print version) vertical line denotes the minimum
2
number of components needed for R to be greater than 0.99. For
LLE, the number of neighbors k is chosen as max(20,n comp ) with
n comp being the number of components. The number of neighbors
can be optimized through benchmarking, to improve the accu-
racy of the reconstructed AP profiles; nonetheless, the number of
components seems to have the most important effect on accuracy.
As shown in the figure, both PCA and LLE require more than 10
components to accurately capture AP dynamics, 15 components