
Page 90 - Artificial Intelligence for Computational Modeling of the Heart
P. 90
60 Chapter 2 Implementation of a patient-specific cardiac model
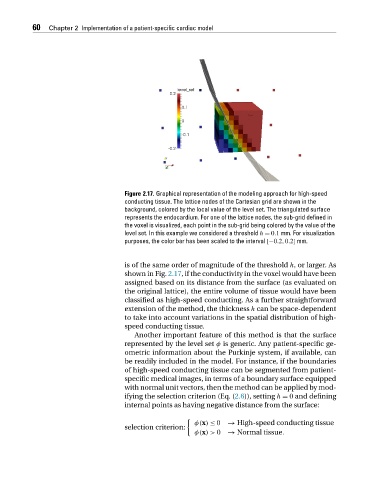
Figure 2.17. Graphical representation of the modeling approach for high-speed
conducting tissue. The lattice nodes of the Cartesian grid are shown in the
background, colored by the local value of the level set. The triangulated surface
represents the endocardium. For one of the lattice nodes, the sub-grid defined in
the voxel is visualized, each point in the sub-grid being colored by the value of the
level set. In this example we considered a threshold h = 0.1 mm. For visualization
purposes, the color bar has been scaled to the interval [−0.2,0.2] mm.
is of the same order of magnitude of the threshold h, or larger. As
shown in Fig. 2.17, if the conductivity in the voxel would have been
assigned based on its distance from the surface (as evaluated on
the original lattice), the entire volume of tissue would have been
classified as high-speed conducting. As a further straightforward
extension of the method, the thickness h can be space-dependent
to take into account variations in the spatial distribution of high-
speed conducting tissue.
Another important feature of this method is that the surface
represented by the level set φ is generic. Any patient-specific ge-
ometric information about the Purkinje system, if available, can
be readily included in the model. For instance, if the boundaries
of high-speed conducting tissue can be segmented from patient-
specific medical images, in terms of a boundary surface equipped
with normal unit vectors, then the method can be applied by mod-
ifying the selection criterion (Eq. (2.6)), setting h = 0 and defining
internal points as having negative distance from the surface:
φ(x) ≤ 0 → High-speed conducting tissue
selection criterion:
φ(x)> 0 → Normal tissue.