
Page 135 - Assurance of Sterility for Sensitive Combination Products and Materials
P. 135
Package/container closures 117
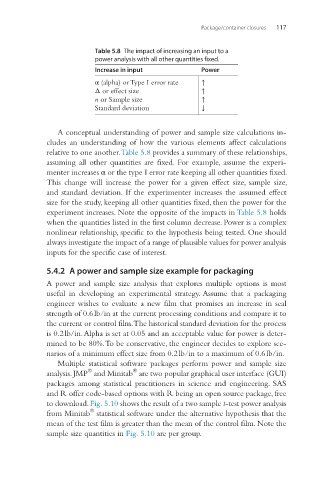
Table 5.8 The impact of increasing an input to a
power analysis with all other quantities fixed.
Increase in input Power
α (alpha) or Type I error rate ↑
Δ or effect size ↑
n or Sample size ↑
Standard deviation ↓
A conceptual understanding of power and sample size calculations in-
cludes an understanding of how the various elements affect calculations
relative to one another. Table 5.8 provides a summary of these relationships,
assuming all other quantities are fixed. For example, assume the experi-
menter increases α or the type I error rate keeping all other quantities fixed.
This change will increase the power for a given effect size, sample size,
and standard deviation. If the experimenter increases the assumed effect
size for the study, keeping all other quantities fixed, then the power for the
experiment increases. Note the opposite of the impacts in Table 5.8 holds
when the quantities listed in the first column decrease. Power is a complex
nonlinear relationship, specific to the hypothesis being tested. One should
always investigate the impact of a range of plausible values for power analysis
inputs for the specific case of interest.
5.4.2 A power and sample size example for packaging
A power and sample size analysis that explores multiple options is most
useful in developing an experimental strategy. Assume that a packaging
engineer wishes to evaluate a new film that promises an increase in seal
strength of 0.6 lb/in at the current processing conditions and compare it to
the current or control film. The historical standard deviation for the process
is 0.2 lb/in. Alpha is set at 0.05 and an acceptable value for power is deter-
mined to be 80%. To be conservative, the engineer decides to explore sce-
narios of a minimum effect size from 0.2 lb/in to a maximum of 0.6 lb/in.
Multiple statistical software packages perform power and sample size
®
®
analysis. JMP and Minitab are two popular graphical user interface (GUI)
packages among statistical practitioners in science and engineering. SAS
and R offer code-based options with R being an open source package, free
to download. Fig. 5.10 shows the result of a two sample t-test power analysis
®
from Minitab statistical software under the alternative hypothesis that the
mean of the test film is greater than the mean of the control film. Note the
sample size quantities in Fig. 5.10 are per group.