
Page 138 - Assurance of Sterility for Sensitive Combination Products and Materials
P. 138
120 Assurance of sterility for sensitive combination products and materials
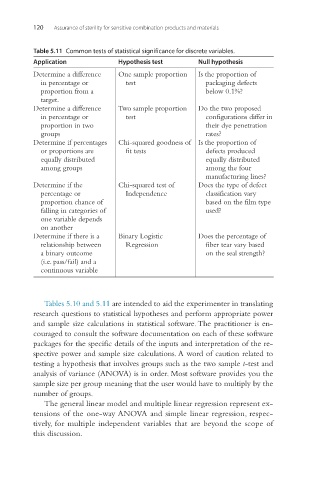
Table 5.11 Common tests of statistical significance for discrete variables.
Application Hypothesis test Null hypothesis
Determine a difference One sample proportion Is the proportion of
in percentage or test packaging defects
proportion from a below 0.1%?
target.
Determine a difference Two sample proportion Do the two proposed
in percentage or test configurations differ in
proportion in two their dye penetration
groups rates?
Determine if percentages Chi-squared goodness of Is the proportion of
or proportions are fit tests defects produced
equally distributed equally distributed
among groups among the four
manufacturing lines?
Determine if the Chi-squared test of Does the type of defect
percentage or Independence classification vary
proportion chance of based on the film type
falling in categories of used?
one variable depends
on another
Determine if there is a Binary Logistic Does the percentage of
relationship between Regression fiber tear vary based
a binary outcome on the seal strength?
(i.e. pass/fail) and a
continuous variable
Tables 5.10 and 5.11 are intended to aid the experimenter in translating
research questions to statistical hypotheses and perform appropriate power
and sample size calculations in statistical software. The practitioner is en-
couraged to consult the software documentation on each of these software
packages for the specific details of the inputs and interpretation of the re-
spective power and sample size calculations. A word of caution related to
testing a hypothesis that involves groups such as the two sample t-test and
analysis of variance (ANOVA) is in order. Most software provides you the
sample size per group meaning that the user would have to multiply by the
number of groups.
The general linear model and multiple linear regression represent ex-
tensions of the one-way ANOVA and simple linear regression, respec-
tively, for multiple independent variables that are beyond the scope of
this discussion.