
Page 136 - Assurance of Sterility for Sensitive Combination Products and Materials
P. 136
118 Assurance of sterility for sensitive combination products and materials
Power curve for 2-sample t test
1.0
Sample
Size
3
0.8 0.8 4
7
14
0.6 a Assumptions 0.05
Power StDev 0.2
Alternative
>
0.4
0.2
0.0
0.0 0.1 0.2 0.3 0.4 0.5 0.6 0.7 0.8
Difference
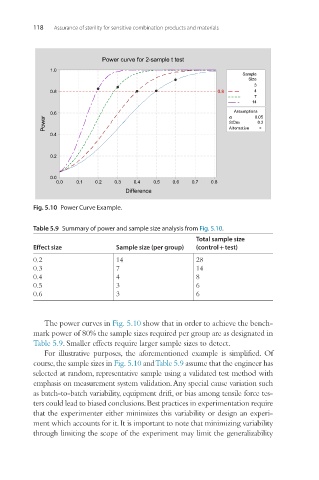
Fig. 5.10 Power Curve Example.
Table 5.9 Summary of power and sample size analysis from Fig. 5.10.
Total sample size
Effect size Sample size (per group) (control + test)
0.2 14 28
0.3 7 14
0.4 4 8
0.5 3 6
0.6 3 6
The power curves in Fig. 5.10 show that in order to achieve the bench-
mark power of 80% the sample sizes required per group are as designated in
Table 5.9. Smaller effects require larger sample sizes to detect.
For illustrative purposes, the aforementioned example is simplified. Of
course, the sample sizes in Fig. 5.10 and Table 5.9 assume that the engineer has
selected at random, representative sample using a validated test method with
emphasis on measurement system validation. Any special cause variation such
as batch-to-batch variability, equipment drift, or bias among tensile force tes-
ters could lead to biased conclusions. Best practices in experimentation require
that the experimenter either minimizes this variability or design an experi-
ment which accounts for it. It is important to note that minimizing variability
through limiting the scope of the experiment may limit the generalizability