
Page 140 - Assurance of Sterility for Sensitive Combination Products and Materials
P. 140
122 Assurance of sterility for sensitive combination products and materials
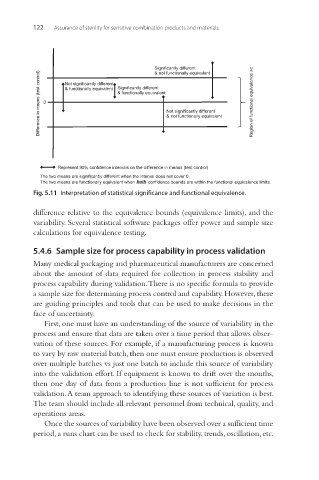
Significantly different
& not functionally equivalent
Difference in means (test control) 0 & functionally equivalent Significantly different Not significantly different Region of functional equivalence ±c
Not significantly different
& functionally equivalent
& not functionally equivalent
Represent 90% confidence intervals on the difference in means (test control)
The two means are significantly different when the interval does not cover 0.
The two means are functionally equivalent when both confidence bounds are within the functional equivalence limits.
Fig. 5.11 Interpretation of statistical significance and functional equivalence.
difference relative to the equivalence bounds (equivalence limits), and the
variability. Several statistical software packages offer power and sample size
calculations for equivalence testing.
5.4.6 Sample size for process capability in process validation
Many medical packaging and pharmaceutical manufacturers are concerned
about the amount of data required for collection in process stability and
process capability during validation. There is no specific formula to provide
a sample size for determining process control and capability. However, there
are guiding principles and tools that can be used to make decisions in the
face of uncertainty.
First, one must have an understanding of the source of variability in the
process and ensure that data are taken over a time period that allows obser-
vation of these sources. For example, if a manufacturing process is known
to vary by raw material batch, then one must ensure production is observed
over multiple batches vs just one batch to include this source of variability
into the validation effort. If equipment is known to drift over the months,
then one day of data from a production line is not sufficient for process
validation. A team approach to identifying these sources of variation is best.
The team should include all relevant personnel from technical, quality, and
operations areas.
Once the sources of variability have been observed over a sufficient time
period, a runs chart can be used to check for stability, trends, oscillation, etc.