
Page 139 - Assurance of Sterility for Sensitive Combination Products and Materials
P. 139
Package/container closures 121
5.4.4 An overview of equivalence testing
Statistical significance testing is used to determine if quantities are sig-
nificantly different than one another. However, experimenters often have
a need to determine if quantities are equivalent within some practical
margin. Determining equivalence is particularly relevant for change man-
agement protocol, ensuring consistent global quality, and qualification of
multiple testing laboratories. It is important to note that finding no signif-
icant difference does not allow for a conclusion of equivalence. Statistical
theory prevents this, allowing only for the conclusion of “there was not
enough evidence to indicate a significant difference.” As its name implies,
equivalence testing can be used to determine the equivalence of quantities
within a prespecified bound. See Stein and Doganoksoy (1999) [92] for
an overview of equivalence testing. Equivalence testing requires subject
matter experts, not statistical practitioners, to determine the appropriate
equivalence bounds.
There are many articles in the statistical literature regarding equivalence
testing. The approach in this section is based on the original two one-sided
test (TOST) approach by Schuirmann (1987) [93]. Equivalence testing for
a test vs control group employs the two sample t-test. Differences in sig-
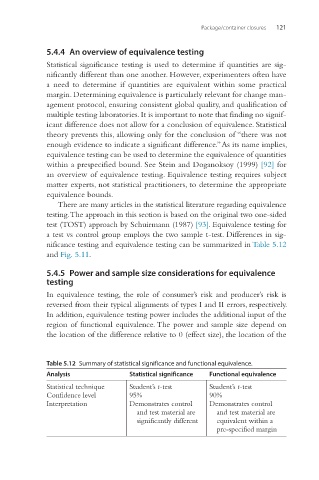
nificance testing and equivalence testing can be summarized in Table 5.12
and Fig. 5.11.
5.4.5 Power and sample size considerations for equivalence
testing
In equivalence testing, the role of consumer’s risk and producer’s risk is
reversed from their typical alignments of types I and II errors, respectively.
In addition, equivalence testing power includes the additional input of the
region of functional equivalence. The power and sample size depend on
the location of the difference relative to 0 (effect size), the location of the
Table 5.12 Summary of statistical significance and functional equivalence.
Analysis Statistical significance Functional equivalence
Statistical technique Student’s t-test Student’s t-test
Confidence level 95% 90%
Interpretation Demonstrates control Demonstrates control
and test material are and test material are
significantly different equivalent within a
pre-specified margin