
Page 137 - Assurance of Sterility for Sensitive Combination Products and Materials
P. 137
Package/container closures 119
of the results. Furthermore, in order to avoid selecting a sample size that is
too small resulting in an underpowered experiment, the standard deviation
estimate used in the power analysis must account for each such source of vari-
ability in order to power the experiment to detect affects over and above the
extraneous sources. For example, one would not want to use a standard devi-
ation for one operator and one test apparatus to plan the test when multiple
operators and multiple tests stands are to be used in the execution of the test.
The additional operators and test stands will introduce additional variability
and make the test plan based on one operator and one test plan underpowered.
5.4.3 Power and sample calculations in practice for
significance testing
Power and sample size calculations are easily performed in a variety of sta-
tistical software packages for testing for statistically significant differences.
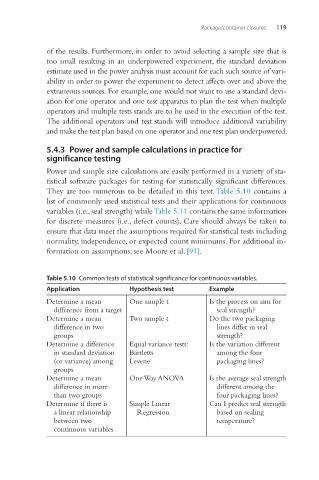
They are too numerous to be detailed in this text. Table 5.10 contains a
list of commonly used statistical tests and their applications for continuous
variables (i.e., seal strength) while Table 5.11 contains the same information
for discrete measures (i.e., defect counts). Care should always be taken to
ensure that data meet the assumptions required for statistical tests including
normality, independence, or expected count minimums. For additional in-
formation on assumptions, see Moore et al. [91].
Table 5.10 Common tests of statistical significance for continuous variables.
Application Hypothesis test Example
Determine a mean One sample t Is the process on aim for
difference from a target seal strength?
Determine a mean Two sample t Do the two packaging
difference in two lines differ in seal
groups strength?
Determine a difference Equal variance tests: Is the variation different
in standard deviation Bartletts among the four
(or variance) among Levene packaging lines?
groups
Determine a mean One Way ANOVA Is the average seal strength
difference in more different among the
than two groups four packaging lines?
Determine if there is Simple Linear Can I predict seal strength
a linear relationship Regression based on sealing
between two temperature?
continuous variables