
Page 380 - Automotive Engineering Powertrain Chassis System and Vehicle Body
P. 380
Braking systems C HAPTER 12.1
forces increase in accordance with the slope of the valve The substitution of the modulation valve for the
characteristic and this causes the overall vehicle brake limiting valve into the brake system of the prototype
ratio to vary, being equal to the slope of the dashed line. If vehicle enables improvements to be made to the adhe-
the slope of the brake force characteristic in region 2 is sion utilization at high rates of deceleration. This is due
x 2
defined as f then the brake force at the rear axle, T r , is: to the ability of the valve to increase the line pressure to
x 2 r
T r ¼ Pz v x r þðPz Pz v Þx 2 (12.1.90) the rear brakes at a reduced rate. By appropriate choice
r
of the slope of the brake force characteristic in region 2,
and the brake force at the front axle is:
the front axle adhesion curve can be forced to move
closer to the optimum. In this example, setting the ratio
T ¼ T T r for region 2 to be x 2 ¼ 0:88 causes the front and rear
f
f
x 2 r 0:12
¼ Pz ðPz v x r þðPz Pz v Þx 2Þ (12.1.91) adhesion curves to cross at a deceleration of 0.8g
r
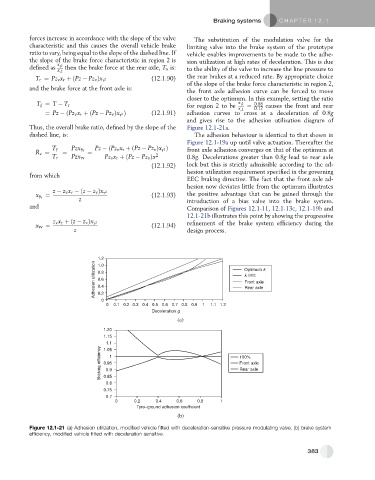
and gives rise to the adhesion utilization diagram of
Thus, the overall brake ratio, defined by the slope of the Figure 12.1-21a.
dashed line, is: The adhesion behaviour is identical to that shown in
Figure 12.1-19a up until valve actuation. Thereafter the
T f Pzx fv Pz ðPz v x r þðPz Pz v Þx 2Þ front axle adhesion converges on that of the optimum at
r
R v ¼ ¼ ¼
T r Pzx rv Pz v x r þðPz Pz v Þx 2 0.8g. Decelerations greater than 0.8g lead to rear axle
(12.1.92) lock but this is strictly admissible according to the ad-
hesion utilization requirement specified in the governing
from which
EEC braking directive. The fact that the front axle ad-
hesion now deviates little from the optimum illustrates
r
z z v x r ðz z v Þx 2
x fv ¼ (12.1.93) the positive advantage that can be gained through the
z introduction of a bias valve into the brake system.
and Comparison of Figures 12.1-11, 12.1-13c, 12.1-19b and
12.1-21b illustrates this point by showing the progressive
r
z v x r þðz z v Þx 2 refinement of the brake system efficiency during the
x rv ¼ (12.1.94)
z design process.
1.2
Adhesion utilization 0.8 Optimum k
1.0
k limit
0.6
Front axle
0.4
Rear axle
0.2
0
0 0.1 0.2 0.3 0.4 0.5 0.6 0.7 0.8 0.9 1 1.1 1.2
Deceleration g
(a)
1.20
1.15
1.1
ficiency 1.05 100%
1
Braking ef 0.95 Front axle
Rear axle
0.9
0.85
0.8
0.75
0.7
0 0.2 0.4 0.6 0.8 1
T yre–ground adhesion coef ficient
(b)
Figure 12.1-21 (a) Adhesion utilization, modified vehicle fitted with deceleration-sensitive pressure modulating valve, (b) brake system
efficiency, modified vehicle fitted with deceleration sensitive.
383