
Page 391 - Automotive Engineering Powertrain Chassis System and Vehicle Body
P. 391
CHAP TER 1 3. 1 Vehicle motion control
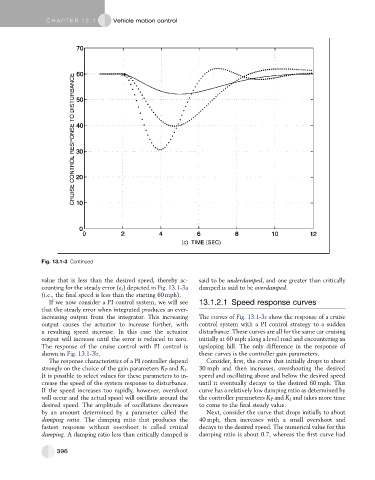
Fig. 13.1-3 Continued
value that is less than the desired speed, thereby ac- said to be underdamped, and one greater than critically
counting for the steady error (e s ) depicted in Fig. 13.1-3a damped is said to be overdamped.
(i.e., the final speed is less than the starting 60 mph).
If we now consider a PI control system, we will see 13.1.2.1 Speed response curves
that the steady error when integrated produces an ever-
increasing output from the integrator. This increasing The curves of Fig. 13.1-3c show the response of a cruise
output causes the actuator to increase further, with control system with a PI control strategy to a sudden
a resulting speed increase. In this case the actuator disturbance. These curves are all for the same car cruising
output will increase until the error is reduced to zero. initially at 60 mph along a level road and encountering an
The response of the cruise control with PI control is upsloping hill. The only difference in the response of
shown in Fig. 13.1-3b. these curves is the controller gain parameters.
The response characteristics of a PI controller depend Consider, first, the curve that initially drops to about
strongly on the choice of the gain parameters K P and K I . 30 mph and then increases, overshooting the desired
It is possible to select values for these parameters to in- speed and oscillating above and below the desired speed
crease the speed of the system response to disturbance. until it eventually decays to the desired 60 mph. This
If the speed increases too rapidly, however, overshoot curve has a relatively low damping ratio as determined by
will occur and the actual speed will oscillate around the the controller parameters K P and K I and takes more time
desired speed. The amplitude of oscillations decreases to come to the final steady value.
by an amount determined by a parameter called the Next, consider the curve that drops initially to about
damping ratio. The damping ratio that produces the 40 mph, then increases with a small overshoot and
fastest response without overshoot is called critical decays to the desired speed. The numerical value for this
damping. A damping ratio less than critically damped is damping ratio is about 0.7, whereas the first curve had
396