
Page 718 - Automotive Engineering Powertrain Chassis System and Vehicle Body
P. 718
Interior noise: Assessment and control C HAPTER 21.1
This is a measure of the degree of association of the R xy ðsÞ¼ E½xðtÞyðt þ sÞ (C21.1.18)
signal at time t 1 and the same signal at time t 2 . Perhaps 2
one could see it as a measure of how predictable future When T / 0, R xx (T) is the variance of x (i.e. x when the
signal levels are based on a historic knowledge of that mean is zero).
signal. The average power in the signal over period T / N is
If the mean values are not subtracted the autocorre- (Sinha, 1991)
lation function is obtained ð
1 T=2
2
P ¼ x ðtÞdt (C21.1.19)
E½xðt 1 Þxðt 2 Þ (C21.1.13) lim T/N T T=2
With a stationary random process m x remains constant Now (Fahy and Walker, 1998) Parseval’s theorem
with time in the period (t 1 t 2 ) states that
R xx ðt 2 t 1 Þ¼ E½ðxðt 1 Þ m Þðxðt 2 Þ m Þ 1 ð T=2 1 ð N 1 ð N
x
x
2
2
2
(C21.1.14) x ðtÞdt ¼ x ðtÞdt ¼ jX T ðf Þj df
T
T T=2 T N T N
Commonly: (C21.1.20)
t 2 ¼ t 1 þ s Where s is the time lag where x T is the truncated data set for x(t) between times
t 1 ¼ t T/2 and T/2. Now, as T / N
ð ð
so 1 T=2 2 N X T ðf Þ 2
P ¼ x ðtÞdt ¼ df
limT/N T T
R xx ðsÞ¼ E½ðxðtÞ m Þðxðt þ sÞ m Þ (C21.1.15) T=2 N
x
x
(C21.1.21)
when
So,
s ¼ 0; R xx ¼ VðxÞ
ð T=2
1
2
When s/N, R xx / 0 as the two random samples tend E P lim T/N ¼ E x ðtÞdt
to be less associated. T T=2
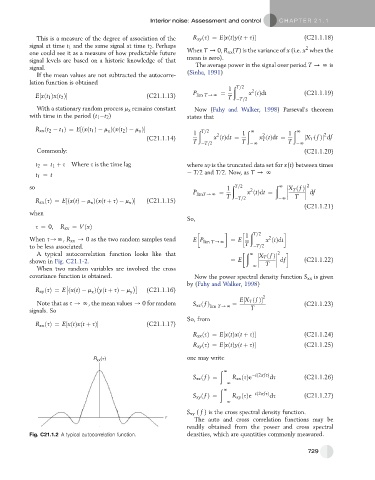
A typical autocorrelation function looks like that ð N X T ðf Þ 2
shown in Fig. C21.1-2. ¼ E T df (C21.1.22)
When two random variables are involved the cross N
covariance function is obtained. Now the power spectral density function S xx is given
by (Fahy and Walker, 1998)
R xy ðsÞ¼ E ðxðtÞ m Þ yðt þ sÞ m y (C21.1.16)
x
E½X T ðf Þ 2
Note that as s / N, the mean values / 0 for random S xx ðf Þ ¼ (C21.1.23)
lim T/N T
signals. So
So, from
R xx ðsÞ¼ E½xðtÞxðt þ sÞ (C21.1.17)
R xx ðsÞ¼ E½xðtÞxðt þ sÞ (C21.1.24)
R xy ðsÞ¼ E½xðtÞyðt þ sÞ (C21.1.25)
one may write
ð
N
S xx ðf Þ¼ R xx ðsÞe ið2pfsÞ ds (C21.1.26)
N
ð
N
S xy ðf Þ¼ R xy ðsÞe ið2pfsÞ ds (C21.1.27)
N
S xy ( f ) is the cross spectral density function.
The auto and cross correlation functions may be
readily obtained from the power and cross spectral
Fig. C21.1.2 A typical autocorrelation function. densities, which are quantities commonly measured.
729