Page 366 - Autonomous Mobile Robots
P. 366

356                                    Autonomous Mobile Robots

                                       (a)  0
                                           10
                                           20
                                           30
                                           40
                                           50

                                           60
                                           70
                                           80
                                           90
                                          100
                                             0  10  20  30  40  50  60  70  80  90 100
                                       (b)                                           1
                                           20                                        0.9
                                           40                                        0.8
                                           60                                        0.7
                                           80                                        0.6
                                          100                                        0.5
                                          120                                        0.4

                                          140                                        0.3
                                          160                                        0.2
                                          180                                        0.1
                                             0  20  40  60  80 100 120 140 160 180 200

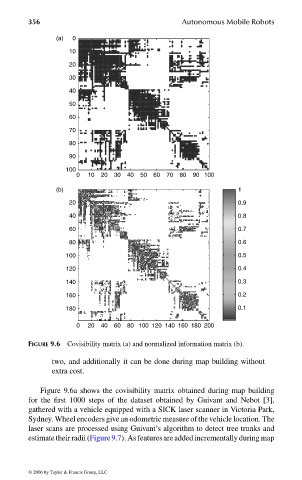
                                FIGURE 9.6 Covisibility matrix (a) and normalized information matrix (b).

                                      two, and additionally it can be done during map building without
                                      extra cost.

                                   Figure 9.6a shows the covisibility matrix obtained during map building
                                for the first 1000 steps of the dataset obtained by Guivant and Nebot [3],
                                gathered with a vehicle equipped with a SICK laser scanner in Victoria Park,
                                Sydney. Wheel encoders give an odometric measure of the vehicle location. The
                                laser scans are processed using Guivant’s algorithm to detect tree trunks and
                                estimate their radii (Figure 9.7). As features are added incrementally during map


                                 © 2006 by Taylor & Francis Group, LLC


                                FRANKL: “dk6033_c009” — 2006/3/31 — 16:43 — page 356 — #26
   361   362   363   364   365   366   367   368   369   370   371