
Page 146 - Basic Gas Chromatography
P. 146
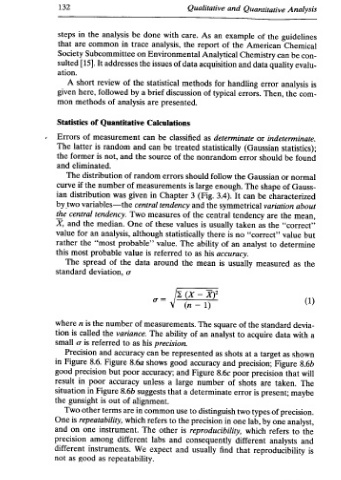
Quantitative Analysis   133  Analysis  Quantitative      guidelines   the   of   Chemical  American   (3  can  Chemistry   con-   be   x  quality   data  evalu-   analysis  error   is   Then,   com-   the   (b)   (a)   fe)   Poor   Poor   Good   :  indeterminate.   or  Accuracy:   Poor   Good   Good  Precision:  statistics);  (Gaussian   Chroma-   M.,  From  Miller,  J.  definitions  of  accuracy  and  precision.   of  the  Illustrations  Fig.


    and   example   the   of   and   handling   errors.  typical   determinate   statistically   error   the  follow   The  enough.   3.4).   can   It   symmetrical   tendency   usually   taken   no   is   analyst   an   of   accuracy.   usually   is   the   of  square   to  analyst   a   at  shots   precision;   and   8.6c   poor   shots   of   error   is   two   in   lab,   one   which   different   find   that
   Qualitative   an   As   care.   report   the   Analytical   acquisition   data   methods   for   of   as   nonrandom   the   should   large   is   (Fig.   3   the   and   central   the   is   there   ability   his   as   mean   XP   [X(xX—   a   The   an   of   represented   as   accuracy   Figure   number   determinate   distinguish   to   precision   reproducibility,   consequently   usually


          with   analysis,   Environmental   of   statistical   discussion   presented.   Calculations   classified   be   treated   be   of   errors   Chapter   tendency   measures   of   values  these   statistically   The   value.   to  referred   the  around   _   measurements.   ability   precision.   be   good   and   a   large   a   that   use   the   to   is  other   and   and

          done   issues   the   brief   are   can   can   source   random   measurements   in   central   of   although   is   o-   The   his   can   shows   accuracy;   unless   suggests   alignment.   common   refers   The   labs   expect

          be   trace   on   the   of   a   by   analysis   and   the   and   of   of   given   Two   One   probable”   value   data   the   a   of   variance.   to   as   accuracy   8.6a   poor   8.6b   of   in   are   which   different   We   repeatability.
          analysis   in   Subcommittee   addresses   review   followed   of   Quantitative   measurement   random   not,   number   was   variables—the   tendency.   median.   analysis,   “most   probable   of   deviation,   number   the   referred   and   Figure   but   accuracy   Figure   out   terms   instrument.   instruments.


          the   common   It   [15].   here,   methods   of   is   is   eliminated.   distribution   the   distribution   the   an   spread   the   is   called   8.6.   precision   poor   in   is   other   repeatability,   one   among   as
          in   are   short        of   latter   former   if   central   and   for   the   most   n   is   is   o   Precision   Figure   in   gunsight   is   on   good
   132    steps   that   Society   sulted   ation.   A   given   mon   Statistics   Errors   The   the   and   The   curve   ian   two   by   the   X,   value   rather   this   The   standard   where   tion   small   in   good   result   situation   the   Two   One   and   precision   different   as   not