
Page 150 - Basic Gas Chromatography
P. 150
Analysis Quantitative Analysis 137 Factors Response With Normalization Area of Example 8.4 TABLE Wt. Corrected Response Abs. % Wt. Factor Area Raw Compound Error Area% % Weight Area TCD 0.64 5.0 Ethanol +2.4 20.0 17.6 3.20 9.0 Hexane 36.0 34.7 6.30 0.70 +13 0.45 0.78 4.0 Benzene -12 16.0 17.2 3.12 0.59 7.0 Ethylacetate 28.0 30.5 5.53 0.79 —2.5
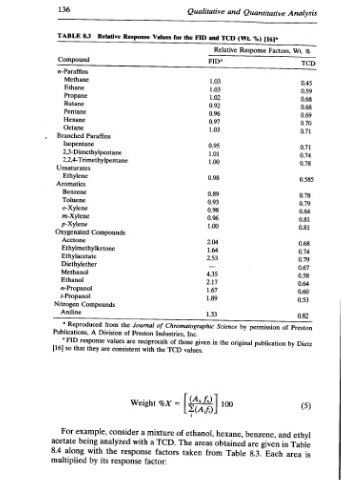
Quantitative [16]* %) Factors, Response permission publication benzene, given are Each 8.3.
and (Wt. TCD Relative by Science the original 100 hexane, obtained Table
Qualitative and FID FID? 1.03 1.03 1.02 0.92 0.96 0.97 1.03 0.95 1.01 1.00 0.98 0.89 0.93 0.98 0.96 1.00 2.04 1.64 2.53 _ 4.35 2.17 1.67 1.89 1.33 Inc. in given values. [2] ethanol, areas taken from
for the Chromatographic Industries, of those TCD of The
Values of reciprocals the mixture TCD. a factors factor:
Response Journal the Preston of are with consistent a consider with response response
Relative Paraffins Compounds from Division values are analyzed the its
8.3 Isopentane 2,3-Dimethylpentane 2,2,4-Trimethylpentane Ethylmethylketone Ethylacetate Diethylether Compounds Reproduced A response they that example, being with by
TABLE Compound n-Paraffins Methane Ethane Propane Butane Pentane Hexane Octane Branched Unsaturates Ethylene Aromatics Benzene Toluene o-Xylene m-Xylene p-Xylene Oxygenated Acetone Methanol Ethanol n-Propanol i-Propanol Nitrogen Aniline Publications, “FID so For along multiplied
136 * [16] acetate 8.4