
Page 151 - Basic Gas Chromatography
P. 151
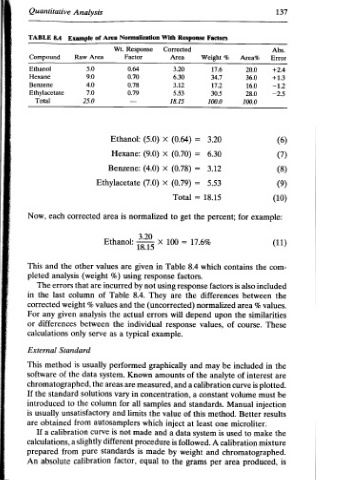
137    Abs.   Error   +2.4   +13   -12   —2.5   (6)   (7)   (8)   (9)   (10)   example:   (11)   com-   included   the   values.   similarities   These   the   in   are   is  plotted.   be   must   injection   results   the   mixture   is


               Area%   20.0   36.0   16.0   28.0   100.0   for   the  contains   also   is   between   %   area   the   course.   included   of  interest   curve   volume   Manual   Better   microliter.   make   to   used   calibration   chromatographed.   produced,


          Factors   %  Weight   17.6   34.7   17.2   30.5   100.0   3.20   6.30   3.12   5.53   18.15   percent;   which   factors   differences   normalized   upon   of  values,   be   may   analyte   calibration   constant   standards.   method.   one   least   is  system   A   and   area   per

          Response                 (0.64)   (0.70)   (0.78)   (0.79)   Total   the   get   17.6%   =   8.4   factors.   response   the   depend   response   and   the   of   and   a   a   this   of   at   data   followed.   weight   grams


          With   Corrected   Area   3.20   6.30   3.12   5.53   18.15   x   X   X   x   to   100   X   Table   in   response   using   are  They   (uncorrected)   will   errors   example.   graphically   amounts   measured,   concentration,   and  samples   the   value   inject   a   and   is   by   made   the   to

          Normalization   Response   Factor   0.64   0.70   0.78   0.79   —   (5.0)  Ethanol:   (9.0)  Hexane:   (4.0)   (7.0)   normalized   3.20  Ethanol: 1815   given   are   using   not   by   8.4.   the   and   actual   individual   typical   performed   Known   are   in   all   limits   which   made   not   procedure   is   equal  factor,


          Area   Wt.                     Benzene:   Ethylacetate   is   area   values   %)   incurred   Table   of   values   the   the   a   as   system.   areas   vary   for  column   and   autosamplers   is   curve   different   standards
    Analysis   of  Example   Area   Raw   5.0   9.0   4.0   7.0   25.0   corrected   other   (weight   are   that   column   %  weight   analysis   between   serve   only   Standard   usually   is   data   the   the   solutions   to   the   unsatisfactory   from   slightly   a   pure   from   calibration


    Quantitative   8.4  TABLE   Compound   Ethanol   Hexane   Benzene   Ethylacetate   Total   each   Now,   This   the   and   analysis  pleted   errors   The   in   last   the   corrected   given   any   For   differences   or   calculations   External   method   This   of  software   chromatographed,   standard   the   If   introduced   usually   is   obtained   are   calibration   a   If   calculations,   prepared   absolute   An


     Analysis   %   Wt.   TCD   0.45   0.59   0.68   0.68   0.69   0.70   0.71   0.71   0.74   0.78   0.585   0.78   0.79   0.84   0.81   0.81   0.68   0.74   0.79   0.67   0.58   0.64   0.60   0.53   0.82   Preston   of   Dietz   by   (5)   and   ethyl   Table   in   area   is


     Quantitative   [16]*   %)   Factors,  Response                           permission   publication   benzene,   given   are   Each   8.3.


     and   (Wt.  TCD   Relative                                               by  Science   the  original   100   hexane,   obtained   Table

     Qualitative   and   FID   FID?   1.03   1.03   1.02   0.92   0.96   0.97   1.03   0.95   1.01   1.00   0.98   0.89   0.93   0.98   0.96   1.00   2.04   1.64   2.53   _   4.35   2.17   1.67   1.89   1.33   Inc.   in  given   values.   [2]   ethanol,   areas   taken   from


          for   the                                                           Chromatographic   Industries,   of   those   TCD   of   The
          Values                                                              of   reciprocals   the   mixture   TCD.   a   factors   factor:


          Response                                                            Journal   the   Preston   of   are   with  consistent   a  consider   with   response   response


          Relative                Paraffins             Compounds             from   Division   values   are   analyzed   the   its


          8.3                      Isopentane  2,3-Dimethylpentane  2,2,4-Trimethylpentane   Ethylmethylketone   Ethylacetate   Compounds   Reproduced   A   response   they   that   example,   being   with   by
          TABLE   Compound   n-Paraffins   Methane   Ethane   Propane   Butane   Pentane   Hexane   Octane   Branched   Unsaturates   Ethylene   Aromatics   Benzene   Toluene   o-Xylene   m-Xylene   p-Xylene   Oxygenated   Acetone   Diethylether   Methanol   Ethanol   n-Propanol   i-Propanol   Aniline   Publications,   “FID   so   For   along   multiplied
    136                                                                  Nitrogen   *   [16]             acetate   8.4