
Page 42 - Biaxial Multiaxial Fatigue and Fracture
P. 42
Evaluation of Fatigue of Fillet Welded Joints in Yehicle Components Under Multiaxial Service Loads 21
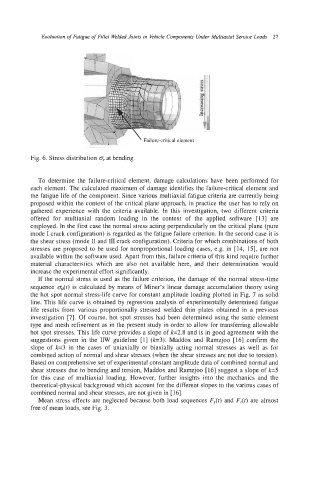
Failure-critical element
Fig. 6. Stress distribution a, at bending.
To determine the failure-critical element, damage calculations have been performed for
each element. The calculated maximum of damage identifies the failure-critical element and
the fatigue life of the component. Since various multiaxial fatigue criteria are currently being
proposed within the context of the critical plane approach, in practice the user has to rely on
gathered experience with the criteria available. In this investigation, two different criteria
offered for multiaxial random loading in the context of the applied software [13] are
employed. In the first case the normal stress acting perpendicularly on the critical plane (pure
mode I crack configuration) is regarded as the fatigue failure criterion. In the second case it is
the shear stress (mode 11 and III crack configuration). Criteria for which combinations of both
stresses are proposed to be used for nonproportional loading cases, e.g. in [14, 151, are not
available within the software used. Apart from this, failure criteria of this kind require further
material characteristics which are also not available here, and their determination would
increase the experimental effort significantly.
If the normal stress is used as the failure criterion, the damage of the normal stress-time
sequence odt) is calculated by means of Miner’s linear damage accumulation theory using
the hot spot normal stress-life curve for constant amplitude loading plotted in Fig. 7 as solid
line. This life curve is obtained by regression analysis of experimentally determined fatigue
life results from various proportionally stressed welded thin plates obtained in a previous
investigation [7]. Of course, hot spot stresses had been determined using the same element
type and mesh refinement as in the present study in order to allow for transferring allowable
hot spot stresses. This life curve provides a slope of k=2.8 and is in good agreement with the
suggestions given in the LIW guideline [l] (k=3). Maddox and Ramzjoo [16] confirm the
slope of k=3 in the cases of uniaxially or biaxially acting normal stresses as well as for
combined action of normal and shear stresses (when the shear stresses are not due to torsion).
Based on comprehensive set of experimental constant amplitude data of combined normal and
shear stresses due to bending and torsion, Maddox and Ramzjoo [16] suggest a slope of k=5
for this case of multiaxial loading. However, further insights into the mechanics and the
theoretical-physical background which account for the different slopes in the various cases of
combined normal and shear stresses, are not given in [ 161.
Mean stress effects are neglected because both load sequences F,(t) and F,(t) are almost
free of mean loads, see Fig. 3.