
Page 43 - Biaxial Multiaxial Fatigue and Fracture
P. 43
28 G. SAVAIDIS ETAL.
800
700
600 normal stress-life curve
500
400 -~
300 - ~ - - _
200 . shear stress-lifecurve - - ~
according to Sonsino [17]
k=5
100
1 o4 1 o5 1 o6 5x10⁶
number of c yc les-to-f ai I u re
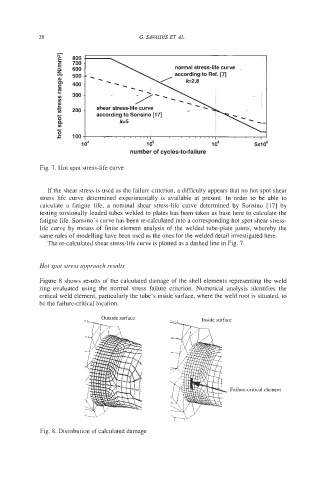
Fig. 7. Hot spot stress-life curve
If the shear stress is used as the failure criterion, a difficulty appears that no hot spot shear
stress life curve determined experimentally is available at present. In order to be able to
calculate a fatigue life, a nominal shear stress-life curve determined by Sonsino [17] by
testing torsionally loaded tubes welded to plates has been taken as base here to calculate the
fatigue life. Sonsino’s curve has been re-calculated into a corresponding hot spot shear stress-
life curve by means of finite element analysis of the welded tube-plate joints, whereby the
same rules of modelling have been used as the ones for the welded detail investigated here.
The re-calculated shear stress-life curve is plotted as a dashed line in Fig. 7.
Hot spot stress approach results
Figure 8 shows results of the calculated damage of the shell elements representing the weld
ring evaluated using the normal stress failure criterion. Numerical analysis identifies the
critical weld element, particularly the tube’s inside surface, where the weld root is situated, to
be the failure-critical location.
Outside surface
Fig. 8. Distribution of calculated damage