
Page 46 - Biaxial Multiaxial Fatigue and Fracture
P. 46
Evaluation of Fatigue of Fillet Welded Joints in Vehicle Components Under Multiaxial Service Loads 3 1
to lmm in accordance with Radaj’s suggestions [2] based on the “worst case” concept. The
stress-life curves corresponding with the acting local stresses and describing the failure
behaviour of steel welds are reported by Olivier [I91 for normal stresses and Olivier and
Amstutz [20] for shear stresses.
Finite element modelling
A very fine mesh of elements is necessary to determine the local notch root stress of this
weld. To restrict the numerical expense, it is recommended to apply a submodelling technique
for its determination.
The submodel is a very detailed finite element model of the weld geometry and its
neighbourhood. In practical engineering applications, it is not possible today to model a
complete component (or even vehicle) down to the last detail. As mentioned above, all weld
notch roots have to be modelled with a radius of Imm. To achieve sufficient accuracy, at least
8 elements with quadratic form functions have to be used to model a notch root quarter circle.
The boundary conditions of the submodel are provided by the coarse model - here the model
applied for hot spot stress calculation - as the displacements at the submodel’s boundary.
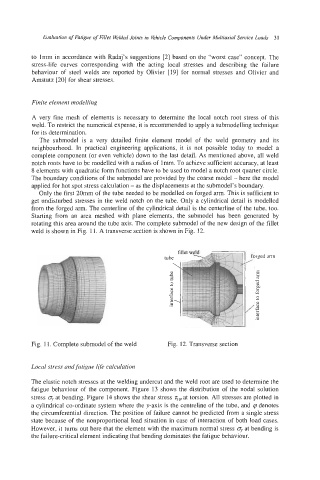
Only the first 20mm of the tube needed to be modelled on forged arm. This is sufficient to
get undisturbed stresses in the weld notch on the tube. Only a cylindrical detail is modelled
from the forged arm. The centerline of the cylindrical detail is the centerline of the tube, too.
Starting from an area meshed with plane elements, the submodel has been generated by
rotating this area around the tube axis. The complete submodel of the new design of the fillet
weld is shown in Fig. 11. A transverse section is shown in Fig. 12.
Fig. 1 1. Complete submodel of the weld Fig. 12. Transverse section
Local stress and fatigue life calculation
The elastic notch stresses at the welding undercut and the weld root are used to determine the
fatigue behaviour of the component. Figure 13 shows the distribution of the nodal solution
stress oy at bending. Figure 14 shows the shear stress qp, at torsion. All stresses are plotted in
a cylindrical co-ordinate system where the y-axis is the centreline of the tube, and q denotes
the circumferential direction. The position of failure cannot be predicted from a single stress
state because of the nonproportional load situation in case of interaction of both load cases.
However, it turns out here that the element with the maximum normal stress o, at bending is
the failure-critical element indicating that bending dominates the fatigue behaviour.