
Page 47 - Biaxial Multiaxial Fatigue and Fracture
P. 47
32 G. SAVAIDIS ET AL.
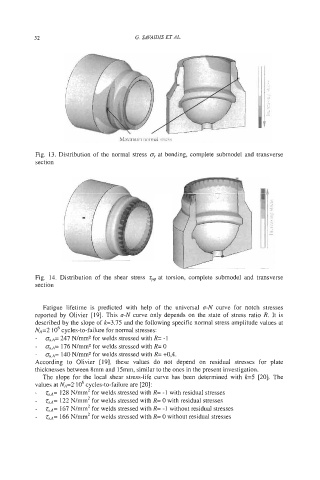
Fig. 13. Distribution of the normal stress O, at bending, complete submodel and transverse
section
/'
Fig. 14. Distribution of the shear stress at torsion, complete submodel and transverse
section
Fatigue lifetime is predicted with help of the universal G-N curve for notch stresses
reported by Olivier [19]. This EN curve only depends on the state of stress ratio R. It is
described by the slope of k=3.75 and the following specific normal stress amplitude values at
I
NA=2 o6 cycles-to-failure for normal stresses:
- gu;.~= 247 N/mmz for welds stressed with R= -1
- C&A= 176 N/mmz for welds stressed with R= 0
- C&A= 140 N/mm2 for welds stressed with R= +0,4.
According to Olivier [19], these values do not depend on residual stresses for plate
thicknesses between 8mm and 15mm, similar to the ones in the present investigation.
The slope for the local shear stress-life curve has been determined with k5 [20]. The
values at N,4=2'106 cycles-to-failure are [~oI:
- G,A= 128 N/mm2 for welds stressed with R= -1 with residual stresses
- %,A= 122 N/mm2 for welds stressed with R= 0 with residual stresses
- %,A= 167 N/mm2 for welds stressed with R= -1 without residual stresses
- z,,A= 166 N/mm2 for welds stressed with R= 0 without residual stresses