
Page 44 - Biaxial Multiaxial Fatigue and Fracture
P. 44
Evaluation of Fatigue of Fillet Welded Joints in Vehicle Components Under Multiaxial Service Loads 29
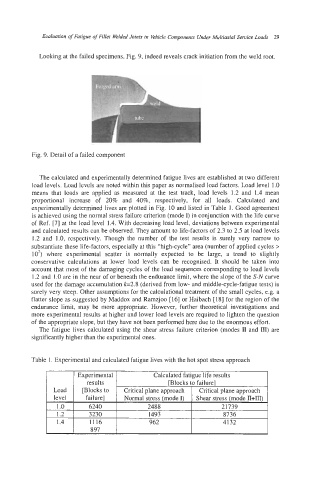
Looking at the failed specimens, Fig. 9, indeed reveals crack initiation from the weld root.
Fig. 9. Detail of a failed component
The calculated and experimentally determined fatigue lives are established at two different
load levels. Load levels are noted within this paper as normalised load factors. Load level 1.0
means that loads are applied as measured at the test track, load levels 1.2 and 1.4 mean
proportional increase of 20% and 40%, respectively, for all loads. Calculated and
experimentally determined lives are plotted in Fig. 10 and listed in Table 1. Good agreement
is achieved using the normal stress failure criterion (mode I) in conjunction with the life curve
of Ref. [7] at the load level 1.4. With decreasing load level, deviations between experimental
and calculated results can be observed. They amount to life-factors of 2.3 to 2.5 at load levels
1.2 and 1.0, respectively. Though the number of the test results is surely very narrow to
substantiate these life-factors, especially at this “high-cycle’’ area (number of applied cycles >
10’) where experimental scatter is normally expected to be large, a trend to slightly
conservative calculations at lower load levels can be recognised. It should be taken into
account that most of the damaging cycles of the load sequences corresponding to load levels
1.2 and 1 .O are in the near of or beneath the endurance limit, where the slope of the S-N curve
used for the damage accumulation k2.8 (derived from low- and middle-cycle-fatigue tests) is
surely very steep. Other assumptions for the calculational treatment of the small cycles, e.g. a
flatter slope as suggested by Maddox and Ramzjoo [ 161 or Haibach [ 181 for the region of the
endurance limit, may be more appropriate. However, further theoretical investigations and
more experimental results at higher and lower load levels are required to lighten the question
of the appropriate slope, but they have not been performed here due to the enormous effort.
The fatigue lives calculated using the shear stress failure criterion (modes ll and III) are
significantly higher than the experimental ones.
Table 1. Experimental and calculated fatigue lives with the hot spot stress approach
Experimental Calculated fatigue life results
results [Blocks to failure]
Load [Blocks to Critical plane approach Critical plane approach
level failure] Normal stress (mode I) Shear stress (mode II+III)
1 .o 6240 2488 21739
1.2 3230 1493 8736
1.4 1116 962 4132
897