
Page 513 - Biaxial Multiaxial Fatigue and Fracture
P. 513
Geometry Variation and Lije Estimates of Biaxial Fatigue Specimens 497
D=- " wi
1
C(l-wi DG )Di
n+l
where n is the number of reference points on a particular plane instead of the number of
increments used in Eq. (1).
Additionally, the damage fraction at each reference point is modified to account for the
reference point depth and the local strain gradient using two weighted functions, wD and wG,
respectively. These functions use a similar linear relation to that used with the previous critical
subsurface path (Eqs 2 and 3):
w. =l-hi
D
H
(7)
where hi is the distance of the i-th reference point to the surface, His a global dimension such
as arbitrary depth, total thickness or diameter of the component. A&eq,i is the maximum value
of a multiaxial strain parameter range obtained on the intersection of the critical subsurface
plane with the surface. It should be noted that, when no strain gradient exists in the critical
plane, the value of the weight function W: is zero and therefore the damage contribution from
each point is equal regardless of its distance from the surface.
This critical subsurface plane model was used to predict the life to failure of the anticlastic
bending tests from two subsurface planes shown in Fig. 10. Both planes were at an angles
pinging from 0' to 90°, one plane aligned at 8= 0' and the other at 8= 45'. In the analysis,
the maximum shear strain parameter was used for the life calculation by employing FEA nodal
results as reference points. However, instead of having a 'cut off' depth, the damage was only
calculated from reference points that contain a strain range value that has a corresponding life
shorter than lo7 cycles to failure in the material strain-life curve, Eq. (5).
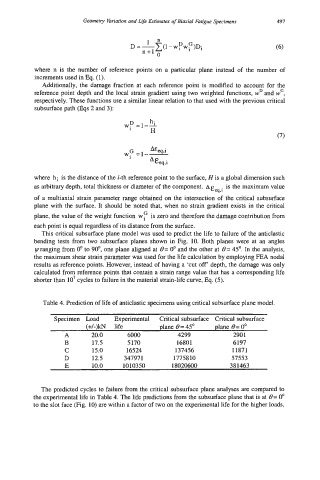
Table 4. Prediction of life of anticlastic specimens using critical subsurface plane model.
Specimen Load Experimental Critical subsurface Critical subsurface
(+/-)kN life plane 8= 45' plane B= 0'
A 20.0 6000 4299 2901
B 17.5 5170 16801 6197
C 15.0 16524 137456 11871
D 12.5 347971 1775810 57553
E 10.0 1010350 18020600 381463
The predicted cycles to failure from the critical subsurface plane analyses are compared to
the experimental life in Table 4. The life predictions from the subsurface plane that is at 8= 0"
to the slot face (Fig. 10) are within a factor of two on the experimental life for the higher loads,