
Page 512 - Biaxial Multiaxial Fatigue and Fracture
P. 512
496 G. SHATIL AND N. ERSOY
Fig. 8. Experimental crack growth direction (a) specimens A and B; (b) specimen C; and (c)
specimens D and E.
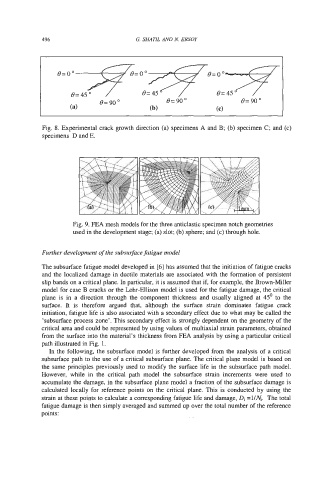
Fig. 9. FEA mesh models for the three anticlastic specimen notch geometries
used in the development stage; (a) slot; (b) sphere; and (c) through hole.
Further development of the subsurface fatigue model
The subsurface fatigue model developed in [6] has assumed that the initiation of fatigue cracks
and the localized damage in ductile materials are associated with the formation of persistent
slip bands on a critical plane. In particular, it is assumed that if, for example, the Brown-Miller
model for case B cracks or the Lohr-Ellison model is used for the fatigue damage, the critical
plane is in a direction through the component thickness and usually aligned at 45’ to the
surface. It is therefore argued that, although the surface strain dominates fatigue crack
initiation, fatigue life is also associated with a secondary effect due to what may be called the
‘subsurface process zone’. This secondary effect is strongly dependent on the geometry of the
critical area and could be represented by using values of multiaxial strain parameters, obtained
from the surface into the material’s thickness from FEA analysis by using a particular critical
path illustrated in Fig. 1.
In the following, the subsurface model is further developed from the analysis of a critical
subsurface path to the use of a critical subsurface plane. The critical plane model is based on
the same principles previously used to modify the surface life in the subsurface path model.
However, while in the critical path model the subsurface strain increments were used to
accumulate the damage, in the subsurface plane model a fraction of the subsurface damage is
calculated locally for reference points on the critical plane. This is conducted by using the
strain at these points to calculate a corresponding fatigue life and damage, Di =l/A!. The total
fatigue damage is then simply averaged and summed up over the total number of the reference
points: