
Page 507 - Biaxial Multiaxial Fatigue and Fracture
P. 507
Geometry Variation and Life Estimates of Biaxial Fatigue Specimens 49 1
plotted for various radial distances, p. Figure 5c depicts the variation of the maximum shear
strain range along two different subsurface paths. Both paths are along an angle of w= 45" to
the surface. One strain path is on a plane of the slot axis (8= 0") and the other is along a 8=
45" plane.
(4
C: constant, F free
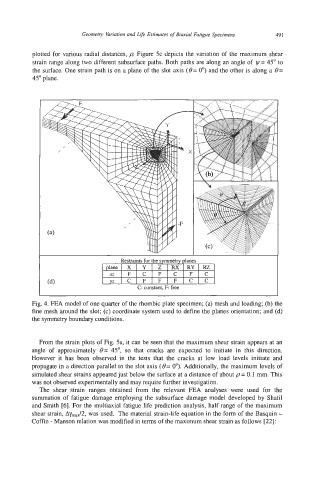
Fig. 4. EA model of one quarter of the rhombic plate specimen; (a) mesh and loading; (b) the
fine mesh around the slot; (c) coordinate system used to define the planes orientation; and (d)
the symmetry boundary conditions.
From the strain plots of Fig. 5a, it can be seen that the maximum shear strain appears at an
angle of approximately 8= 45", so that cracks are expected to initiate in this direction.
However it has been observed in the tests that the cracks at low load levels initiate and
propagate in a direction parallel to the slot axis (8= 0"). Additionally, the maximum levels of
simulated shear strains appeared just below the surface at a distance of about p = 0.1 mm. This
was not observed experimentally and may require further investigation.
The shear strain ranges obtained from the relevant FEA analyses were used for the
summation of fatigue damage employing the subsurface damage model developed by Shatil
and Smith [6]. For the multiaxial fatigue life prediction analysis, half range of the maximum
shear strain, AymJ2, was used. The material strain-life equation in the form of the Basquin -
Coffin - Manson relation was modified in terms of the maximum shear strain as follows [22]: