
Page 506 - Biaxial Multiaxial Fatigue and Fracture
P. 506
490 G. SHATIL AND N. ERSOY
Results
Testing commenced using a W specimen that failed after 3500 cycles with cracking near one
of the rollers' edge. Further improvement in the design of the rollers resulted in five successful
tests, with cracks initiating from the EDM slot. The tests were carried out using reversed cyclic
loads of 10, 12.5, 15, 17.5 and 20kN and were terminated when the surface crack reached the
length of lmm. While at the higher loads of 20, 17.5 and 15kN major surface cracks appeared
to grow at angle of approximately 45" to the slot direction, a shallow and long (5mm) hair like
crack, aligned with the slot direction, was observed in the 10 and 12.5kN tests. The test results
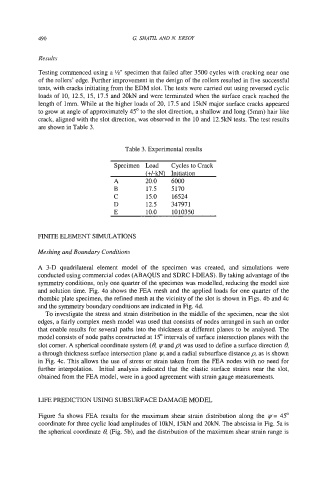
are shown in Table 3.
Table 3. Experimental results
Specimen Load Cycles to Crack
(+/-kN) Initiation
A 20.0 6000
B 17.5 5170
C 15.0 16524
D 12.5 347971
E 10.0 1010350
FINITE ELEMENT SIMULATIONS
Meshing and Boundary Conditions
A 3-D quadrilateral element model of the specimen was created, and simulations were
conducted using commercial codes (ABAQUS and SDRC I-DEAS). By taking advantage of the
symmetry conditions, only one quarter of the specimen was modelled, reducing the model size
and solution time. Fig. 4a shows the FEA mesh and the applied loads for one quarter of the
rhombic plate specimen, the refined mesh at the vicinity of the slot is shown in Figs. 4b and 4c
and the symmetry boundary conditions are indicated in Fig. 4d.
To investigate the stress and strain distribution in the middle of the specimen, near the slot
edges, a fairly complex mesh model was used that consists of nodes arranged in such an order
that enable results for several paths into the thickness at different planes to be analysed. The
model consists of node paths constructed at 15" intervals of surface intersection planes with the
slot comer. A spherical coordinate system (0, yand p) was used to define a surface direction 8,
a through thickness surface intersection plane I,U, and a radial subsurface distance p, as is shown
in Fig. 4c. This allows the use of stress or strain taken from the FEA nodes with no need for
further interpolation. Initial analysis indicated that the elastic surface strains near the slot,
obtained from the FEA model, were in a good agreement with strain gauge measurements.
LIFE PREDICTION USING SUBSURFACE DAMAGE MODEL
Figure 5a shows FEA results for the maximum shear strain distribution along the y= 45"
coordinate for three cyclic load amplitudes of lOkN, 15kN and 20kN. The abscissa in Fig. 5a is
the spherical coordinate 0, (Fig. 5b), and the distribution of the maximum shear strain range is