Page 509 - Biaxial Multiaxial Fatigue and Fracture
P. 509
Geomehy Yariation and Life Estimates of Biaxial Fatigue Specimens   493


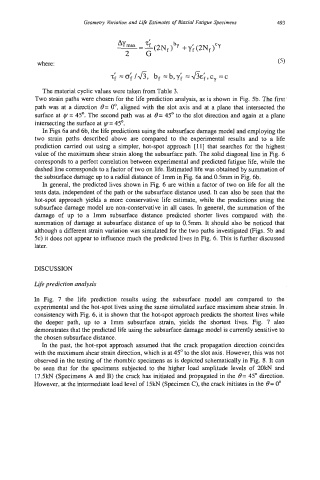
            where:


             The material cyclic values were taken from Table 3.
           Two strain paths were chosen for the life prediction analysis, as is shown in Fig. 5b. The first
           path was at a direction  e= O',  aligned with the slot axis and at a plane that intersected the
           surface at  y= 45'.  The second path was at e= 45'  to the slot direction and again at a plane
           intersecting the surface at y= 45'.
             In Figs 6a and 6b, the life predictions using the subsurface damage model and employing the
           two  strain  paths  described  above  are  compared  to  the  experimental  results  and  to  a  life
           prediction carried  out using a  simpler, hot-spot  approach [ll] that  searches for the  highest
           value of the maximum shear strain along the subsurface path. The solid diagonal line in Fig. 6
           corresponds to a perfect correlation between experimental and predicted fatigue life, while the
           dashed line corresponds to a factor of two on life. Estimated life was obtained by summation of
           the subsurface damage up to a radial distance of  lmm in Fig. 6a and OSmm in Fig. 6b.
             In general, the predicted lives shown in Fig. 6 are within a factor of two on life for all the
           tests data, independent of the path or the subsurface distance used. It can also be seen that the
           hot-spot  approach yields a  more conservative life estimate, while the  predictions  using  the
           subsurface damage model are non-conservative in all cases. In general, the summation of the
           damage  of  up  to  a  lmm  subsurface  distance  predicted  shorter  lives  compared  with  the
           summation of damage at subsurface distance of up to 0.5mm. It should also be noticed that
           although a different strain variation was simulated for the two paths investigated (Figs. 5b and
           5c) it does not appear to influence much the predicted lives in Fig. 6. This is further discussed
           later.


           DISCUSSION

           Life prediction analysis
           In  Fig.  7  the  life  prediction  results  using  the  subsurface  model  are  compared  to  the
           experimental and the hot-spot lives using the same simulated surface maximum shear strain. In
           consistency with Fig. 6, it is shown that the hot-spot approach predicts the shortest lives while
           the  deeper  path,  up  to  a  lmm  subsurface  strain,  yields  the  shortest  lives.  Fig.  7  also
           demonstrates that the predicted life using the subsurface damage model is currently sensitive to
           the chosen subsurface distance.
             In the past, the hot-spot approach assumed that the crack propagation direction coincides
           with the maximum shear strain direction, which is at 45'  to the slot axis. However, this was not
           observed in the testing of the rhombic specimens as is depicted schematically in Fig. 8. It can
           be  seen that  for the  specimens subjected to  the  higher  load amplitude levels  of  20kN  and
           17.5kN (Specimens A and B) the crack has initiated and propagated in the e= 45O direction.
           However, at the intermediate load level of  15kN (Specimen C), the crack initiates in the e= 0'

