
Page 53 - Biaxial Multiaxial Fatigue and Fracture
P. 53
38 G. SAMIDIS ET AL.
COMPARISON OF RESULTS CALCULATED WITH THE HOT SPOT STRESS
APPROACH AND THE LOCAL STRESS APPROACH
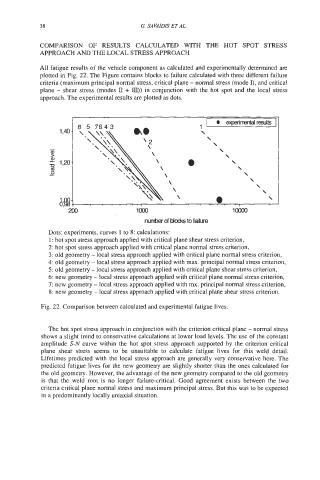
All fatigue results of the vehicle component as calculated and experimentally determined are
plotted in Fig. 22. The Figure contains blocks to failure calculated with three different failure
criteria (maximum principal normal stress, critical plane - normal stress (mode I), and critical
plane - shear stress (modes II + III)) in conjunction with the hot spot and the local stress
approach. The experimental results are plotted as dots.
I 0 experimentalresults
1
\
\
\
\
\
\
\
\
\
\
e,, \ \
.
-,.... I
200 loo00
nurrber of blccks to failure
Dots: experiments, curves 1 to 8: calculations:
1 : hot spot stress approach applied with critical plane shear stress criterion,
2: hot spot stress approach applied with critical plane normal stress criterion,
3: old geometry - local stress approach applied with critical plane normal stress criterion,
4: old geometry - local stress approach applied with max. principal normal stress criterion,
5: old geometry - local stress approach applied with critical plane shear stress criterion,
6: new geometry - local stress approach applied with critical plane normal stress criterion,
7: new geometry - local stress approach applied with mx. principal normal stress criterion,
8: new geometry - local stress approach applied with critical plane shear stress criterion.
Fig. 22. Comparison between calculated and experimental fatigue lives.
The hot spot stress approach in conjunction with the criterion critical plane - normal stress
shows a slight trend to conservative calculations at lower load levels. The use of the constant
amplitude S-N curve within the hot spot stress approach supported by the criterion critical
plane shear stress seems to be unsuitable to calculate fatigue lives for this weld detail.
Lifetimes predicted with the local stress approach are generally very conservative here. The
predicted fatigue lives for the new geometry are slightly shorter than the ones calculated for
the old geometry. However, the advantage of the new geometry compared to the old geometry
is that the weld root is no longer failure-critical. Good agreement exists between the two
criteria critical plane normal stress and maximum principal stress. But this was to be expected
in a predominantly locally uniaxial situation.