
Page 128 - Biomedical Engineering and Design Handbook Volume 1, Fundamentals
P. 128
RESPIRATORY MECHANICS AND GAS EXCHANGE 105
alveolar ventilation and alveolar CO is well known clinically. Hyperventilation drops alveolar, and
2
hence arterial, CO levels whereas hypoventilation raises them. Using a similar approach for oxygen
2
consumption V and using the results of the CO balance yields the ventilation-perfusion equation
O 2 2
.
V A 863 RC ( ao 2 − C V O 2 )
= (4.7)
Q P
A CO 2
Equation 4.7 uses the definition of the respiratory exchange ratio, RV= CO 2 / V , which usually has a
O 2
value of R ª 0.8 for VQ / = 1. It also replaces the end capillary concentration with the systemic
A
arterial value, C = C , assuming equilibration. From Eq. (4.7), the extreme limits of VQ /, men-
A
ao 2 co 2
tioned earlier, may be recognized. Intermediate solutions are more complicated, however, since there
are nonlinear relationships between gas partial pressure and gas content or concentration in the
blood. Equation 4.7 also demonstrates that higher VQ /, as occurs in the upper lung, is consistent
A
with a higher end capillary and alveolar oxygen level. It is often thought that tuberculosis favors the
upper lung for this reason.
The VQ/ variation leads to pulmonary venous blood having a mix of contributions from different
lung regions. Consequently, there is a difference between the lung-average alveolar P and the
Ao 2
average or systemic arterial P , sometimes called the A-a gradient of O . An average P can be
ao 2 2 Ao 2
derived from the alveolar gas equation,
P
P = P − A CO 2 + f (4.8)
R
Io 2
A O 2
which derives from the mass balance for O in Fig. 4.12. Here P is the inspired value and f is a
2 Io 2
, which can be substituted
small correction normally ignored. Clinically, an arterial sample yields P aco 2
for P in Eq. (4.8). The A-a gradient becomes abnormally large in several lung diseases that cause
Aco 2
increased mismatching of ventilation and perfusion.
4.6 AIRWAY FLOW, DYNAMICS, AND STABILITY
4.6.1 Forced Expiration and Flow Limitation
A common test of lung function consists of measur-
ing flow rate by a spirometer apparatus. When the
flow signal is integrated with time, the lung volume
is found. Important information is contained in the
volume versus time curves. The amount of volume
forcefully exhaled with maximum effort in 1 second,
FEV1, divided by the maximal volume exhaled or
forced vital capacity, FVC, is a dimensionless ratio
used to separate restrictive and obstructive lung disease
from normal lungs. FEV1/FVC is normally
80 percent or higher, but in obstructed lungs (asthma,
emphysema) the patient cannot exhale very much
volume in 1 second, so FEV1/FVC drops to diagnos-
tically low levels, say 40 percent. The restricted lung
(fibrosis) has smaller than normal FVC, though the
FEV1/FVC ratio may fall in the normal range because
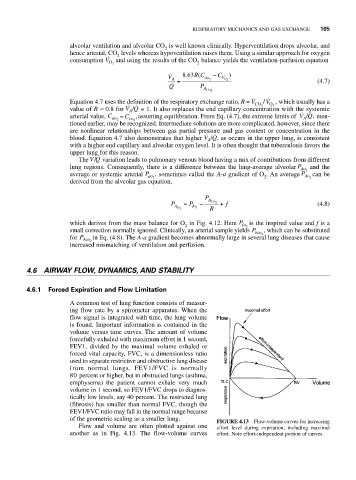
of the geometric scaling as a smaller lung.
FIGURE 4.13 Flow-volume curves for increasing
Flow and volume are often plotted against one effort level during expiration, including maximal
another as in Fig. 4.13. The flow-volume curves effort. Note effort-independent portion of curves.