
Page 125 - Biomedical Engineering and Design Handbook Volume 1, Fundamentals
P. 125
102 BIOMECHANICS OF THE HUMAN BODY
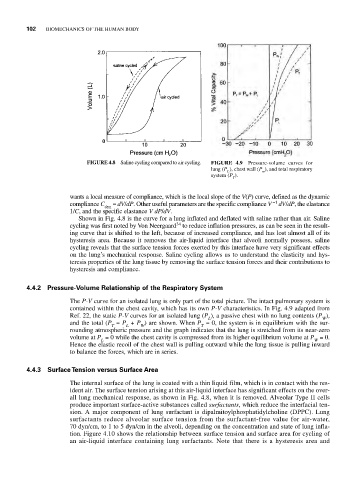
FIGURE 4.8 Saline cycling compared to air cycling. FIGURE 4.9 Pressure-volume curves for
lung (P ), chest wall (P ), and total respiratory
w
L
system (P ).
T
wants a local measure of compliance, which is the local slope of the V(P) curve, defined as the dynamic
compliance C = dV/dP. Other useful parameters are the specific compliance V −1 dV/dP, the elastance
dyn
1/C, and the specific elastance V dP/dV.
Shown in Fig. 4.8 is the curve for a lung inflated and deflated with saline rather than air. Saline
34
cycling was first noted by Von Neergaard to reduce inflation pressures, as can be seen in the result-
ing curve that is shifted to the left, because of increased compliance, and has lost almost all of its
hysteresis area. Because it removes the air-liquid interface that alveoli normally possess, saline
cycling reveals that the surface tension forces exerted by this interface have very significant effects
on the lung’s mechanical response. Saline cycling allows us to understand the elasticity and hys-
teresis properties of the lung tissue by removing the surface tension forces and their contributions to
hysteresis and compliance.
4.4.2 Pressure-Volume Relationship of the Respiratory System
The P-V curve for an isolated lung is only part of the total picture. The intact pulmonary system is
contained within the chest cavity, which has its own P-V characteristics. In Fig. 4.9 adapted from
Ref. 22, the static P-V curves for an isolated lung (P ), a passive chest with no lung contents (P ),
L W
and the total (P = P + P ) are shown. When P = 0, the system is in equilibrium with the sur-
T L W T
rounding atmospheric pressure and the graph indicates that the lung is stretched from its near-zero
volume at P = 0 while the chest cavity is compressed from its higher equilibrium volume at P = 0.
L W
Hence the elastic recoil of the chest wall is pulling outward while the lung tissue is pulling inward
to balance the forces, which are in series.
4.4.3 Surface Tension versus Surface Area
The internal surface of the lung is coated with a thin liquid film, which is in contact with the res-
ident air. The surface tension arising at this air-liquid interface has significant effects on the over-
all lung mechanical response, as shown in Fig. 4.8, when it is removed. Alveolar Type II cells
produce important surface-active substances called surfactants, which reduce the interfacial ten-
sion. A major component of lung surfactant is dipalmitoylphosphatidylcholine (DPPC). Lung
surfactants reduce alveolar surface tension from the surfactant-free value for air-water,
70 dyn/cm, to 1 to 5 dyn/cm in the alveoli, depending on the concentration and state of lung infla-
tion. Figure 4.10 shows the relationship between surface tension and surface area for cycling of
an air-liquid interface containing lung surfactants. Note that there is a hysteresis area and