
Page 123 - Biomedical Engineering and Design Handbook Volume 1, Fundamentals
P. 123
100 BIOMECHANICS OF THE HUMAN BODY
where k depends on the wall roughness; a typical value is k = 0.04. Experiments of inspiratory flow
31
with a multigeneration cast of the central airways show that Poiseuille effects dominate for 350 ≤
Re ≤ 500, entrance effects for 500 ≤ Re ≤ 4000, and rough-walled turbulent effects for 4000 ≤
0
0
Re ≤ 30,000, approximately. C tends to be higher during expiration than inspiration.
0 F
19
As shown from measurements in airway models or theories using modifications of the friction
coefficients, 28 the vast majority of the pressure drop across the entire lung occurs within the large
airways, say 0 ≤ n ≤ 8. Thus clinical evaluation of total airway resistance can miss diseases of the
small airways whose diameters are less than 2 mm, the so-called silent zone of the network. Pressure
drop measurements and models are also important for the design of ventilators and other respiratory
assist or therapeutic devices that interface with lung mechanics.
4.3.3 Gas Transport
Transport of O , CO , anesthetics, toxins, or any other soluble gas occurs by convection, diffusion,
2 2
and their interplay. The ability of one gas species to diffuse through another is quantified by the
molecular diffusivity D for the gas pair. For O diffusing through air, the value of D is D O 2 −air = 0.22
2
2
2
cm /s (at atmospheric pressure and 37°C), whereas for CO the value is less, D = 0.17 cm /s.
2 CO 2 −air
A characteristic time for diffusion to provide effective transport of a concentration front over a
2
distance L is T = L /D, where L can be the airway length L . By contrast, a characteristic time for
d n
convective transport over the same distance is T = L/U, where U = u is the average flow speed of
c n
the bulk gas mixture in an airway. The ratio of the two time scales tells us which mechanism, diffu-
sion, or convection, may dominate (i.e., occur in the shortest time) in a given airway situation. This
ratio is the Peclet number, Pe = T d /T = UL/D, where Pe >> 1 indicates convection-dominated
c
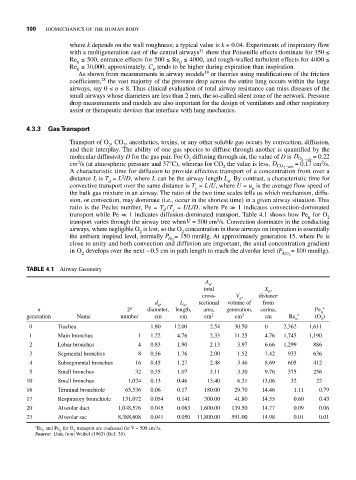
transport while Pe << 1 indicates diffusion-dominated transport. Table 4.1 shows how Pe for O 2
n
3
V
transport varies through the airway tree when = 500 cm /s. Convection dominates in the conducting
airways, where negligible O is lost, so the O concentration in these airways on inspiration is essentially
2
2
the ambient inspired level, normally P = 150 mmHg. At approximately generation 15, where Pe is
Io 2
close to unity and both convection and diffusion are important, the axial concentration gradient
in O develops over the next ~0.5 cm in path length to reach the alveolar level (P = 100 mmHg).
2 Aco 2
TABLE 4.1 Airway Geometry
A ,
n
total X ,
n
cross- V , distance
n
d , L , sectional volume of from
n
n
n 2 n diameter, length, area, generation, carina, Pe n ∗
generation Name number cm cm cm 2 cm 3 cm Re ∗ (O )
n 2
0 Trachea 1.80 12.00 2.54 30.50 0 2,362 1,611
1 Main bronchus 1 1.22 4.76 2.33 11.25 4.76 1,745 1,190
2 Lobar bronchus 4 0.83 1.90 2.13 3.97 6.66 1,299 886
3 Segmental bronchus 8 0.56 1.76 2.00 1.52 7.42 933 636
4 Subsegmental bronchus 16 0.45 1.27 2.48 3.46 8.69 605 412
5 Small bronchus 32 0.35 1.07 3.11 3.30 9.76 375 256
10 Small bronchus 1,024 0.13 0.46 13.40 6.21 13.06 32 22
16 Terminal bronchiole 65,536 0.06 0.17 180.00 29.70 14.46 1.11 0.79
17 Respiratory bronchiole 131,072 0.054 0.141 300.00 41.80 14.55 0.60 0.43
20 Alveolar duct 1,048,576 0.045 0.083 1,600.00 139.50 14.77 0.09 0.06
23 Alveolar sac 8,388,608 0.041 0.050 11,800.00 591.00 14.98 0.01 0.01
∗ Re and Pe for O transport are evaluated for V = 500 cm /s.
3
n n 2
Source: Data from Weibel (1963) (Ref. 35).