
Page 124 - Biomedical Engineering and Design Handbook Volume 1, Fundamentals
P. 124
RESPIRATORY MECHANICS AND GAS EXCHANGE 101
CO has the reverse gradient during inspiration from its alveolar level (P Aco 2 = 40 mmHg) to the ambient
2
level of near zero. During expiration the alveolar levels of both gases are forced out through the airway tree.
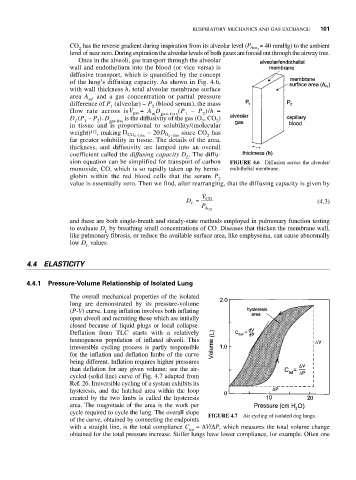
Once in the alveoli, gas transport through the alveolar
wall and endothelium into the blood (or vice versa) is
diffusive transport, which is quantified by the concept
of the lung’s diffusing capacity. As shown in Fig. 4.6,
with wall thickness h, total alveolar membrane surface
area A , and a gas concentration or partial pressure
m
difference of P (alveolar) − P (blood serum), the mass
1
2
flow rate across isV gas = A D gas-tiss (P − P )/h =
2
m
1
D (P − P ). D gas-tiss is the diffusivity of the gas (O , CO )
L
1
2
2
2
in tissue and is proportional to solubility/(molecular
weight) 1/2 , making D ~ 20D since CO has
CO 2 -tiss O 2 -tiss 2
far greater solubility in tissue. The details of the area,
thickness, and diffusivity are lumped into an overall
coefficient called the diffusing capacity D . The diffu-
L
sion equation can be simplified for transport of carbon FIGURE 4.6 Diffusion across the alveolar/
monoxide, CO, which is so rapidly taken up by hemo- endothelial membrane.
globin within the red blood cells that the serum P 2
value is essentially zero. Then we find, after rearranging, that the diffusing capacity is given by
V
D = CO (4.3)
L
P
A CO
and there are both single-breath and steady-state methods employed in pulmonary function testing
to evaluate D by breathing small concentrations of CO. Diseases that thicken the membrane wall,
L
like pulmonary fibrosis, or reduce the available surface area, like emphysema, can cause abnormally
low D values.
L
4.4 ELASTICITY
4.4.1 Pressure-Volume Relationship of Isolated Lung
The overall mechanical properties of the isolated
lung are demonstrated by its pressure-volume
(P-V) curve. Lung inflation involves both inflating
open alveoli and recruiting those which are initially
closed because of liquid plugs or local collapse.
Deflation from TLC starts with a relatively
homogenous population of inflated alveoli. This
irreversible cycling process is partly responsible
for the inflation and deflation limbs of the curve
being different. Inflation requires higher pressures
than deflation for any given volume; see the air-
cycled (solid line) curve of Fig. 4.7 adapted from
Ref. 26. Irreversible cycling of a system exhibits its
hysteresis, and the hatched area within the loop
created by the two limbs is called the hysteresis
area. The magnitude of the area is the work per
cycle required to cycle the lung. The overall slope
FIGURE 4.7 Air cycling of isolated dog lungs.
of the curve, obtained by connecting the endpoints
with a straight line, is the total compliance C =ΔV/ΔP, which measures the total volume change
tot
obtained for the total pressure increase. Stiffer lungs have lower compliance, for example. Often one