
Page 208 - Biomedical Engineering and Design Handbook Volume 1, Fundamentals
P. 208
BIOMECHANICS OF THE MUSCULOSKELETAL SYSTEM 185
HS OTO OHS TO
2974
ERSP
2416
GMAX
2594
GMED
2814
HAMS
6865
VAS
1651
GAS
3016
SOL
0 20 40 60 80 100
Gait cycle (%)
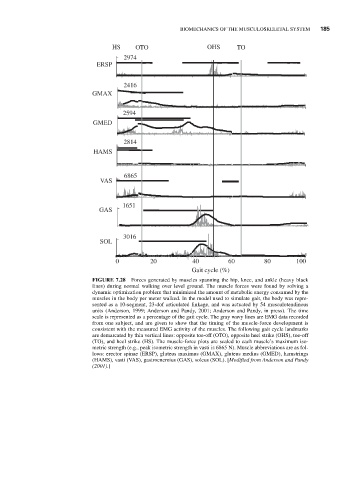
FIGURE 7.28 Forces generated by muscles spanning the hip, knee, and ankle (heavy black
lines) during normal walking over level ground. The muscle forces were found by solving a
dynamic optimization problem that minimized the amount of metabolic energy consumed by the
muscles in the body per meter walked. In the model used to simulate gait, the body was repre-
sented as a 10-segment, 23-dof articulated linkage, and was actuated by 54 musculotendinous
units (Anderson, 1999; Anderson and Pandy, 2001; Anderson and Pandy, in press). The time
scale is represented as a percentage of the gait cycle. The gray wavy lines are EMG data recorded
from one subject, and are given to show that the timing of the muscle-force development is
consistent with the measured EMG activity of the muscles. The following gait cycle landmarks
are demarcated by thin vertical lines: opposite toe-off (OTO), opposite heel strike (OHS), toe-off
(TO), and heel strike (HS). The muscle-force plots are scaled to each muscle’s maximum iso-
metric strength (e.g., peak isometric strength in vasti is 6865 N). Muscle abbreviations are as fol-
lows: erector spinae (ERSP), gluteus maximus (GMAX), gluteus medius (GMED), hamstrings
(HAMS), vasti (VAS), gastrocnemius (GAS), soleus (SOL). [Modified from Anderson and Pandy
(2001).]