
Page 324 - Biomedical Engineering and Design Handbook Volume 1, Fundamentals
P. 324
ELECTROMYOGRAPHY AS A TOOL TO ESTIMATE MUSCLE FORCES 301
TABLE 12.3 Statistical Results of Calibration and Prediction on the Knee Joint of the Walking Trials of
Subject #2
RMS error Normalized RMS
.
2
Subject Trial R value (N m) error (%)
Calibration 1 0.928 7.42 6.30
1
Prediction 2~3 (Mean value (SD)) 0.908 (0.008) 9.98 (1.21) 8.39 (1.00)
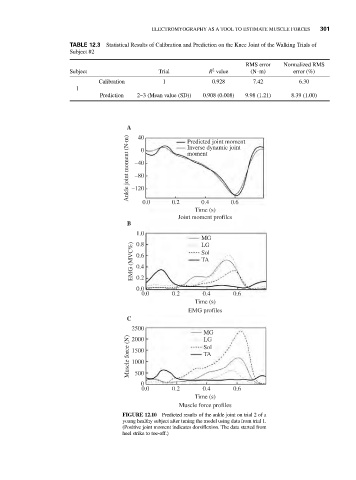
A 40 Predicted joint moment
Ankle joint moment (N·m) –40 0 moment
Inverse dynamic joint
–80
–120
0.0 0.2 0.4 0.6
Time (s)
Joint moment profiles
B
1.0
MG
0.8
EMG (MVC%) 0.6 Sol
LG
TA
0.4
0.2
0.0
0.0 0.2 0.4 0.6
Time (s)
EMG profiles
C
2500
MG
Muscle force (N) 1500 Sol
LG
2000
TA
1000
500
0
0.0 0.2 0.4 0.6
Time (s)
Muscle force profiles
FIGURE 12.10 Predicted results of the ankle joint on trial 2 of a
young healthy subject after tuning the model using data from trial 1.
(Positive joint moment indicates dorsiflexion. The data started from
heel strike to toe-off.)