
Page 325 - Biomedical Engineering and Design Handbook Volume 1, Fundamentals
P. 325
302 BIOMECHANICS OF THE HUMAN BODY
Table 12.2). The EMG profile and muscle force profile of the prediction trial on the ankle joint of
subject #1 shows the onset/offset of the dorsiflexor and plantarflexors, corresponding to the ankle
joint moment patterns (Fig. 12.10b, 12.10c).
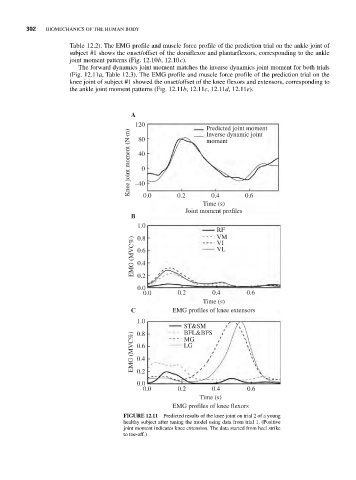
The forward dynamics joint moment matches the inverse dynamics joint moment for both trials
(Fig. 12.11a, Table 12.3). The EMG profile and muscle force profile of the prediction trial on the
knee joint of subject #1 showed the onset/offset of the knee flexors and extensors, corresponding to
the ankle joint moment patterns (Fig. 12.11b, 12.11c, 12.11d, 12.11e).
A
120 Predicted joint moment
Knee joint moment (N·m) 40
Inverse dynamic joint
80
moment
0
–40
0.0
0.4
0.2
Time (s) 0.6
Joint moment profiles
B
1.0
RF
VM
0.8
EMG (MVC%) 0.6 VL
VI
0.4
0.2
0.0
0.0 0.2 0.4 0.6
Time (s)
C EMG profiles of knee extensors
1.0
ST&SM
BFL&BFS
0.8
EMG (MVC%) 0.6 MG
LG
0.4
0.2
0.0
0.0 0.2 0.4 0.6
Time (s)
EMG profiles of knee flexors
FIGURE 12.11 Predicted results of the knee joint on trial 2 of a young
healthy subject after tuning the model using data from trial 1. (Positive
joint moment indicates knee extension. The data started from heel strike
to toe-off.)