
Page 77 - Biosystems Engineering
P. 77
58 Chapter Two
100
Magnitude (dB) –50 0
50
–100
10 –2 10 –1 10 0 10 1 10 2
200
100
Phase (°) –100 0
–200
10 –2 10 –1 10 0 10 1 10 2
Frequency (rad/s)
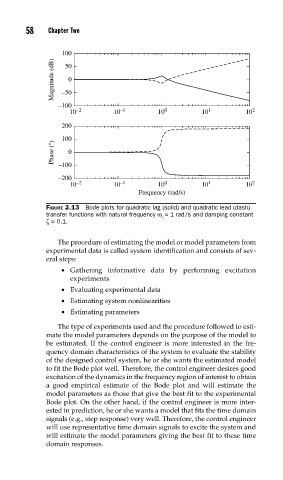
FIGURE 2.13 Bode plots for quadratic lag (solid) and quadratic lead (dash)
transfer functions with natural frequency ω = 1 rad/s and damping constant
n
ζ = 0.1.
The procedure of estimating the model or model parameters from
experimental data is called system identification and consists of sev-
eral steps:
• Gathering informative data by performing excitation
experiments
• Evaluating experimental data
• Estimating system nonlinearities
• Estimating parameters
The type of experiments used and the procedure followed to esti-
mate the model parameters depends on the purpose of the model to
be estimated. If the control engineer is more interested in the fre-
quency domain characteristics of the system to evaluate the stability
of the designed control system, he or she wants the estimated model
to fit the Bode plot well. Therefore, the control engineer desires good
excitation of the dynamics in the frequency region of interest to obtain
a good empirical estimate of the Bode plot and will estimate the
model parameters as those that give the best fit to the experimental
Bode plot. On the other hand, if the control engineer is more inter-
ested in prediction, he or she wants a model that fits the time domain
signals (e.g., step response) very well. Therefore, the control engineer
will use representative time domain signals to excite the system and
will estimate the model parameters giving the best fit to these time
domain responses.