
Page 80 - Biosystems Engineering
P. 80
Biosystems Analysis and Optimization 61
3 3
2 2
1 1
Input (u) 0 Output (u) 0
–1 –1
–2 –2
–3 –3
0 100 200 300 400 500 0 100 200 300 400 500
Time (s) Time (s)
(a) (b)
60 80
60
40
Magnitude (dB) 20 Magnitude (dB) 40 0
20
0
–20
–20 –40
10 –2 10 –1 10 0 10 1 10 –2 10 –1 10 0 10 1
Frequency (Hz) Frequency (Hz)
(c) (d)
100
Magnitude (dB) 0
–100
10 –2 10 –1 10 0 10 1
Frequency (Hz)
0
Phase (°) –200
–400
10 –2 10 –1 10 0 10 1
Frequency (Hz)
(e)
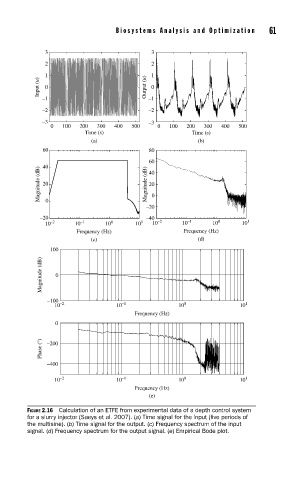
FIGURE 2.16 Calculation of an ETFE from experimental data of a depth control system
for a slurry injector (Saeys et al. 2007). (a) Time signal for the input (fi ve periods of
the multisine). (b) Time signal for the output. (c) Frequency spectrum of the input
signal. (d) Frequency spectrum for the output signal. (e) Empirical Bode plot.