
Page 83 - Biosystems Engineering
P. 83
64 Chapter Two
40
30
Magnitude (dB) 20
10
0
–10
10 –1 10 0
Frequency (Hz)
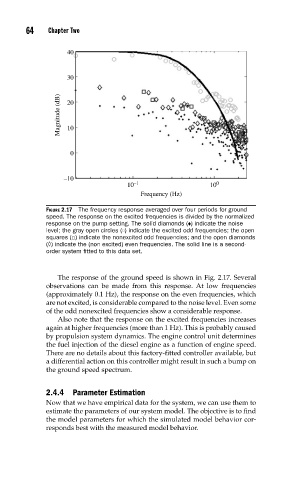
FIGURE 2.17 The frequency response averaged over four periods for ground
speed. The response on the excited frequencies is divided by the normalized
response on the pump setting. The solid diamonds (♦) indicate the noise
level; the gray open circles ( ) indicate the excited odd frequencies; the open
squares ( ) indicate the nonexcited odd frequencies; and the open diamonds
(◊) indicate the (non excited) even frequencies. The solid line is a second-
order system fi tted to this data set.
The response of the ground speed is shown in Fig. 2.17. Several
observations can be made from this response. At low frequencies
(approximately 0.1 Hz), the response on the even frequencies, which
are not excited, is considerable compared to the noise level. Even some
of the odd nonexcited frequencies show a considerable response.
Also note that the response on the excited frequencies increases
again at higher frequencies (more than 1 Hz). This is probably caused
by propulsion system dynamics. The engine control unit determines
the fuel injection of the diesel engine as a function of engine speed.
There are no details about this factory-fitted controller available, but
a differential action on this controller might result in such a bump on
the ground speed spectrum.
2.4.4 Parameter Estimation
Now that we have empirical data for the system, we can use them to
estimate the parameters of our system model. The objective is to find
the model parameters for which the simulated model behavior cor-
responds best with the measured model behavior.