
Page 97 - Biosystems Engineering
P. 97
78 Chapter Two
Output error: The difference between the desired and the actual
machine speed.
Input effort: Change of engine speed and change of pump setting.
This is a regularization term to make the trade-off between both
control inputs and between control inputs and control errors.
Engine speed: Engine speed minus minimal engine speed. This term
leads to a minimization of the engine speed, and thus of engine
noise and exhaust fumes.
2.6.4 System Modeling
Static Model
First, a static model is derived. This model statically links pump set-
ting and engine speed to the machine speed. To derive this model,
two test series have been performed:
• Slowly increase the pump setting, while the engine speed
remains constant (for several engine-speed values).
• Slowly increase the engine speed, while keeping the pump
setting constant (for several pump settings).
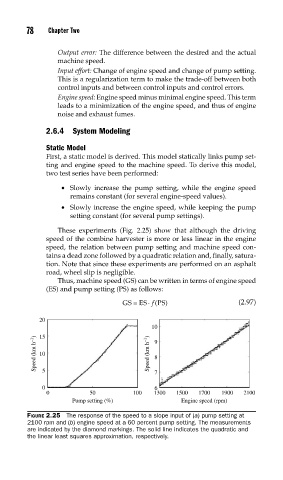
These experiments (Fig. 2.25) show that although the driving
speed of the combine harvester is more or less linear in the engine
speed, the relation between pump setting and machine speed con-
tains a dead zone followed by a quadratic relation and, finally, satura-
tion. Note that since these experiments are performed on an asphalt
road, wheel slip is negligible.
Thus, machine speed (GS) can be written in terms of engine speed
(ES) and pump setting (PS) as follows:
GS = ES⋅ f( PS) (2.97)
20
10
15
Speed (km h –1 ) 10 5 Speed (km h –1 ) 9 8
0 7 6
0 50 100 1300 1500 1700 1900 2100
Pump setting (%) Engine speed (rpm)
FIGURE 2.25 The response of the speed to a slope input of (a) pump setting at
2100 rpm and (b) engine speed at a 60 percent pump setting. The measurements
are indicated by the diamond markings. The solid line indicates the quadratic and
the linear least squares approximation, respectively.