
Page 98 - Biosystems Engineering
P. 98
Biosystems Analysis and Optimization 79
where f is a nonlinear function of the pump setting. This relation can
thus also be written as
⋅
⋅
GS = α( PS ES PS (2.98)
)
where α is the pump setting–dependent amplification. This amplifica-
tion can be calculated by dividing the measured relation between pump
setting and machine speed by the engine speed. In practice, however, a
realigned model is often used. This model is independent of the actual
plant response, because it is realigned to the measurements in every time
step (Maciejowski 2002), predicting the change in output as a function of
the change in input. Equation (2.98) then becomes
⋅
)
ΔGS = β( PS ⋅ Δ ES PS) (2.99)
(
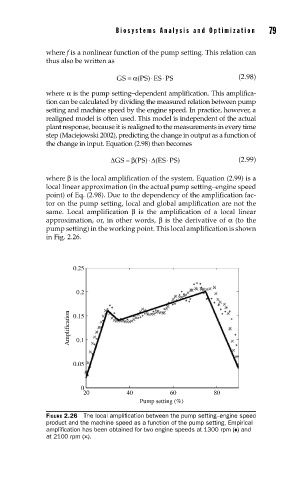
where β is the local amplification of the system. Equation (2.99) is a
local linear approximation (in the actual pump setting–engine speed
point) of Eq. (2.98). Due to the dependency of the amplification fac-
tor on the pump setting, local and global amplification are not the
same. Local amplification β is the amplification of a local linear
approximation, or, in other words, β is the derivative of α (to the
pump setting) in the working point. This local amplification is shown
in Fig. 2.26.
0.25
0.2
Amplification 0.15
0.1
0.05
0
20 40 60 80
Pump setting (%)
FIGURE 2.26 The local amplifi cation between the pump setting–engine speed
product and the machine speed as a function of the pump setting. Empirical
amplifi cation has been obtained for two engine speeds at 1300 rpm (♦) and
at 2100 rpm (×).